Tag: waste

Household Waste Recyling in Spain

An interesting blog post titled ‘Cuando las cuentas no cuentan’ (which I would figuratively translate as ‘When the numbers don’t match’) by Sergio Sastre over at the ‘Residuos Profesional’ blog.

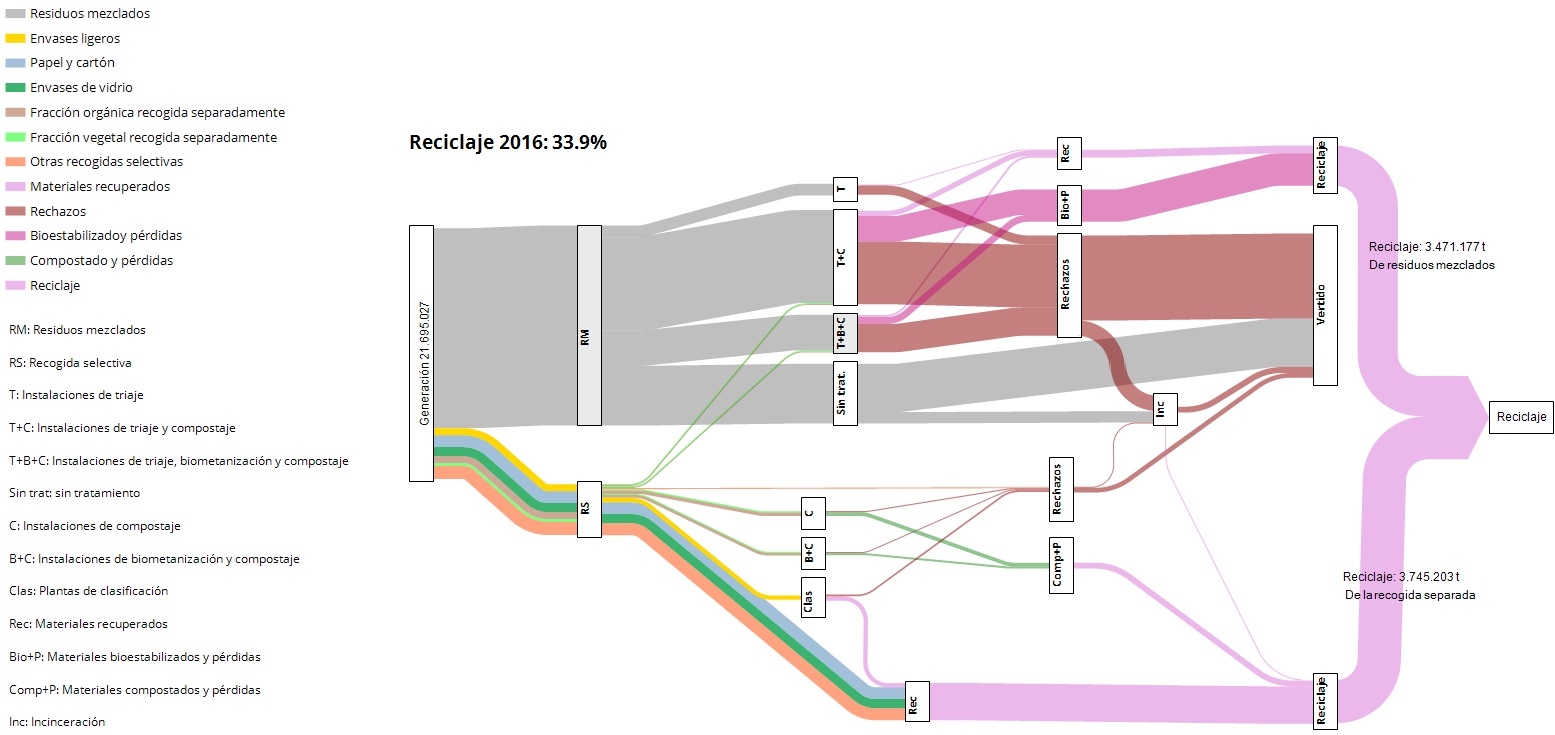
Looking in detail at the official municipal solid waste recycling numbers for all 17 autonomous communities in Spain, published by the Environment Ministry (Ministerio para la Transición Ecológica – MITECO) for 2016, Sergio and his team found that there are discrepancies in the data, and that data quality needs improvement.

The overall recycling rate for municipal solid waste (MSW) in Spain is 33.6% … still far from the 2020 goal to reach a 50% recycling rate.

This Sankey diagram shows the breakdown of waste streams.

Flows are in tonnes per year. Of the overall 21.7 million tonnes of MSW generated in Spain, only some 7.2 million tonnes were recycled in 2016 (pink streams). A large chunk if household waste is mixed (grey stream, residuos mezclados, RM), while only a quarter is collected separately (colored streams in the lower part of the figure, recogida selectiva, RS).

Some material can be recovered from the mixed waste stream at sorting facilities and in composting plants or biogas digestors.
Precious Metals and Critical Raw Materials

The EU funded PROSUM research project looks at ‘Prospecting Secondary raw materials in the Urban mine and Mining wastes’. The more than 15 institutions participating in the project have recently published their findings in a final report.

The report has some interesting Sankey diagrams on market input, stocks, waste generation and waste flows for product groups such as vehicles, batteries, precious materials and selected critical raw materials (CRMs) contained in batteries, electrical and electronic equipment (EEE) and vehicles.

Here is the diagram for vehicles in the EU28+2 (=EU28 plus Switzerland and Norway) market. Data relates to the year 2015.

Flows are in tons and ktons, blending two scales in one diagram. This merits its own post, I think. (read it here)

The electric vehicles currently driving on the roads are shown as “Stock”, meaning that the materials are in use and that they could eventually be recovered at the end of the life of the vehicle. This is the large stackd bar between “POM” (placed on market) and “De-reg Vehicles”. Again this stacked bar uses two different scales (tons and ktons).

Official report citation: Jaco Huisman, Pascal Leroy, François Tertre, Maria Ljunggren Söderman, Perrine Chancerel, Daniel Cassard, Amund N. Løvik, Patrick Wäger, Duncan Kushnir, Vera Susanne Rotter, Paul Mählitz, Lucía Herreras, Johanna Emmerich, Anders Hallberg, Hina Habib, Michelle Wagner, Sarah Downes. Prospecting Secondary Raw Materials in the Urban Mine and mining wastes (ProSUM) – Final Report, ISBN: 978-92-808-9060-0 (print), 978-92-808-9061-7 (electronic), December 21, 2017, Brussels, Belgium

U.S. Plastic Waste Streams

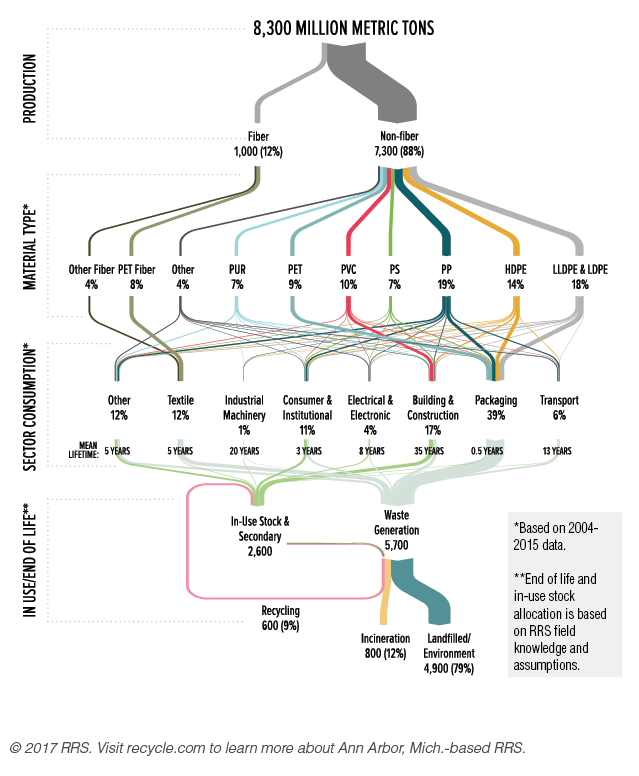
Ann Arbor based consulting firm RRS has published a Sankey diagam visualization of the plastic streams in the United States. This is from their Data Corner blog.

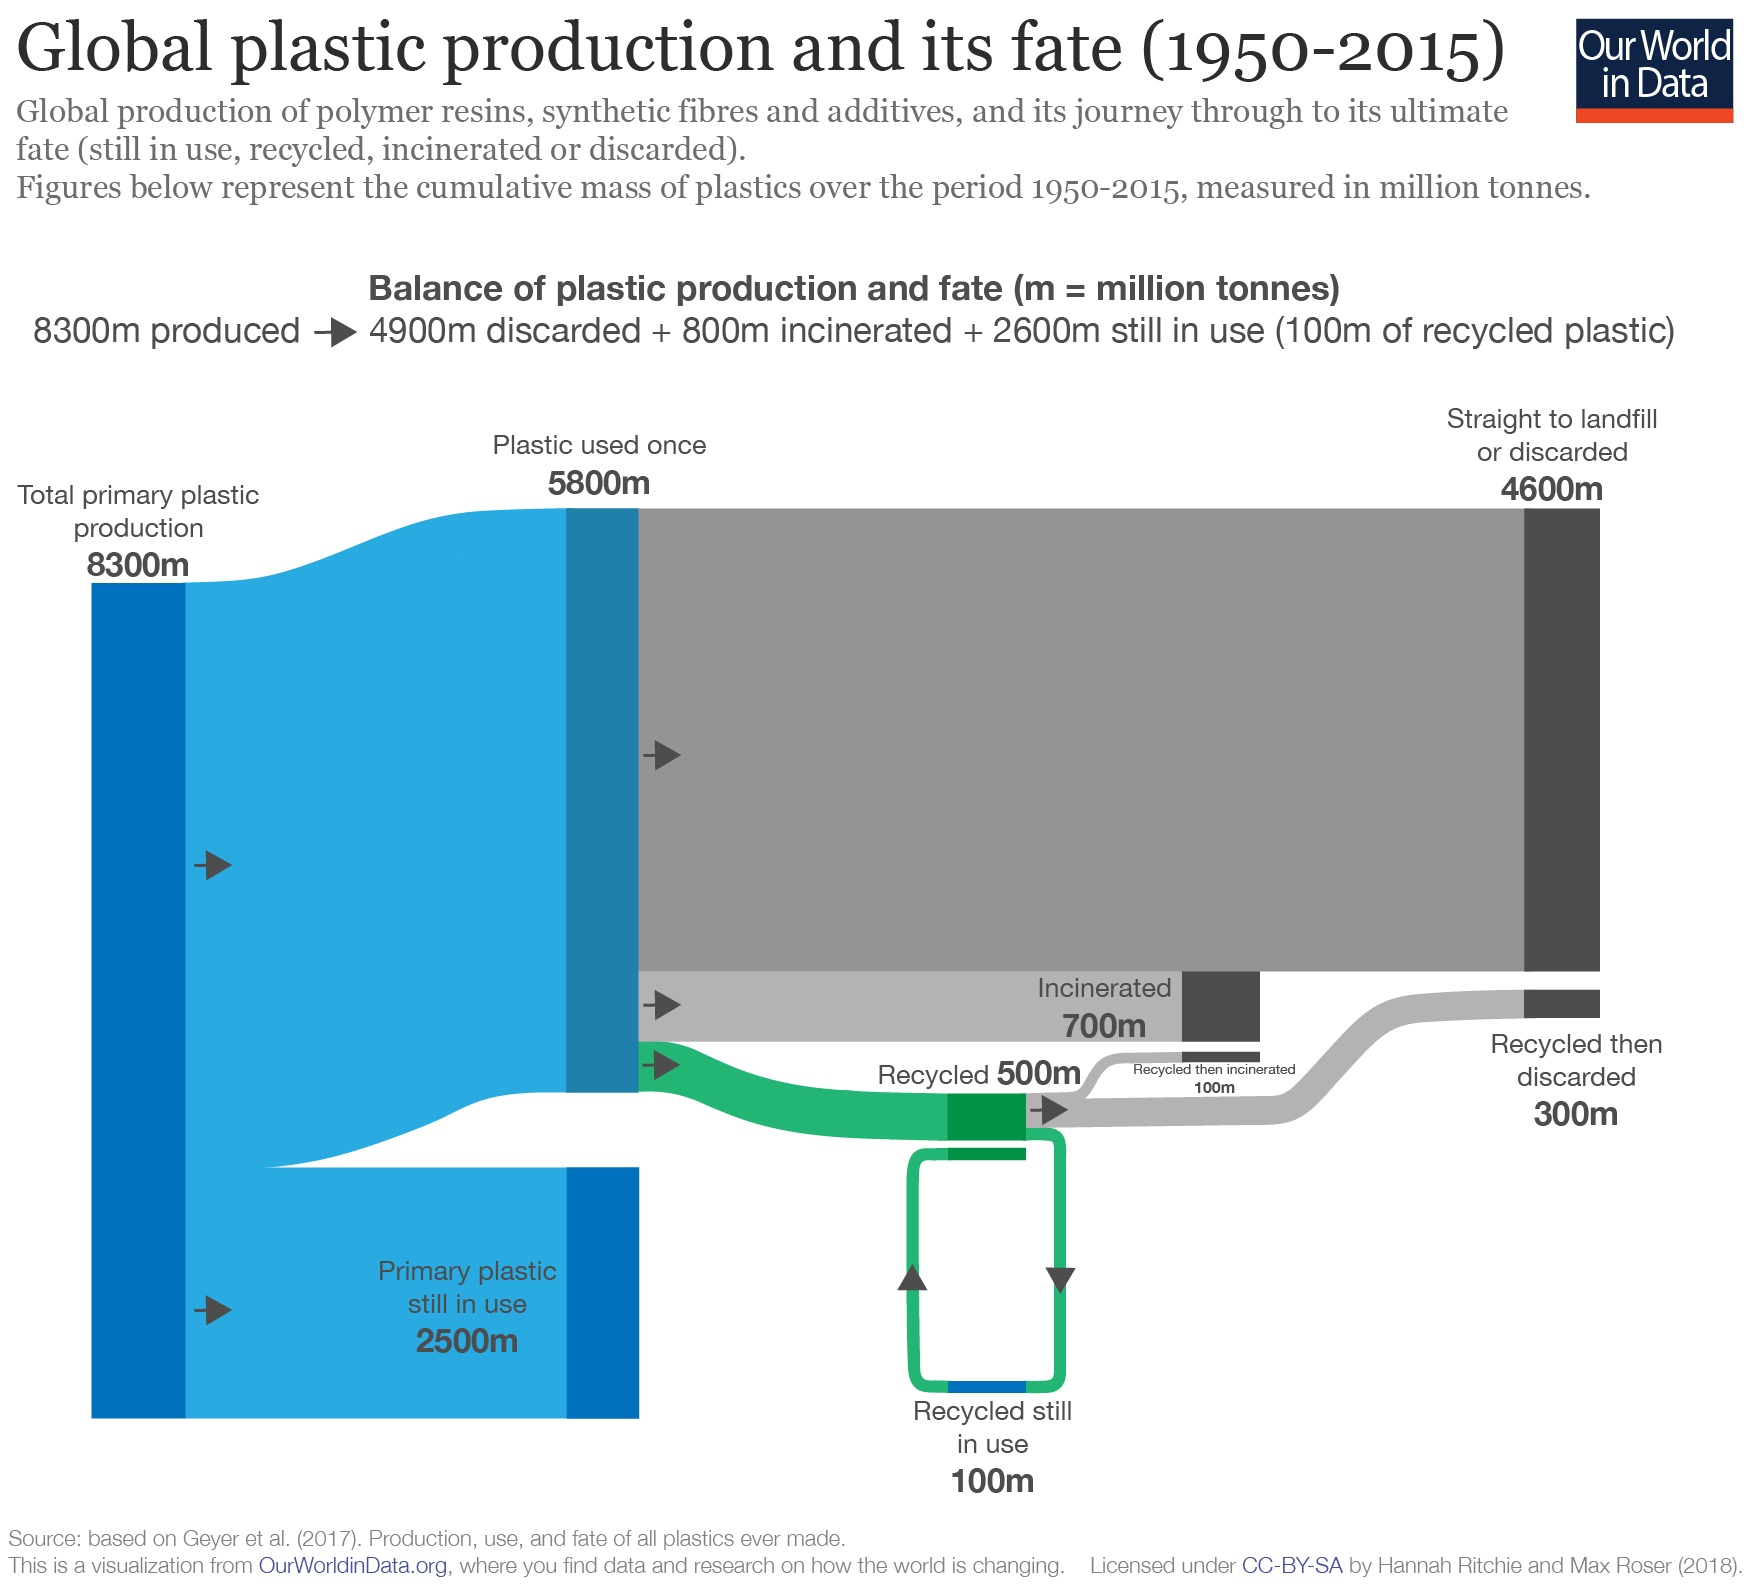
Breakdown is in percentage values only. The amount of 8,300 MMT seems to be an aggregated figure for a 65 year period from 1950 to 2015. And 80% has ended up on landfills.

Original data is from a study ‘Production, Use, and Fate of All Plastics Ever Made’ authored by Roland Geyer of the University of California, Santa Barbara; Jenna Jambeck of the University of Georgia; and Kara Law from the Sea Education Association.

Global Plastics, Ellen MacArthur Foundation

This week the global plastics flows topic made the news and social media with the publication of the EU Plastics Strategy and Chancellor Philip Hammond presenting the United Kingdom’s plan for tackling plastic waste.

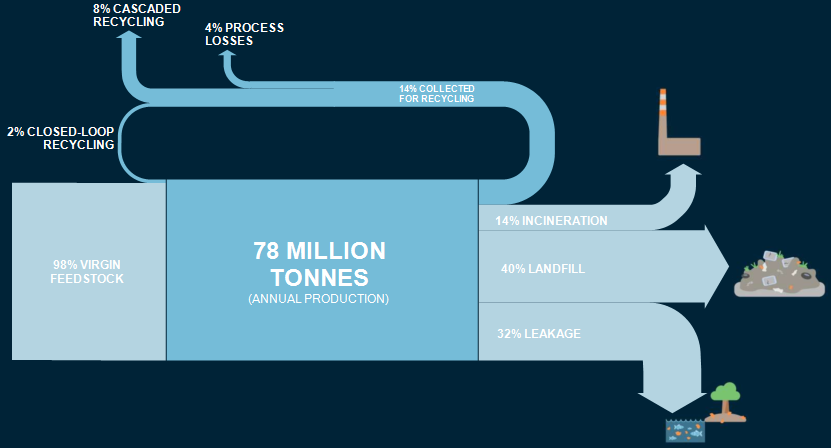
Ellen MacArthur Foundation has long been active in research and awareness building in this field. It aims at supporting a transition to a circular economy. The foundation tweeting under @circulareconomy contributed this Sankey diagram. It is from a 2016 report they produced together with the World Economic Forum and McKinsey.

The Sankey diagram shows indeed, that “today, plastic packaging material flows are largely linear”. This beautifully crafted diagram had already caught my attention back in 2016 when I first saw it.

However, I had this subtle feeling that something was wrong here. Not regarding the content or the data … but rather that something wasn’t OK in the Sankey diagram, Just my gut feeling. Now, seeing the Sankey diagram again in the above tweet this week, I finally sat to quickly do a remake of this Sankey diagram. Here it is:

I stuck to the original layout and design as closely as possible, using the same color codes and even the white all caps font. While transfering the numbers (all percentage values, so no issue there), it immediately became clear to me what caused my irritation. Can you identify it yourself by comparing the two pics?

Won’t give it away now and wait for your comments. Will post the answers to this small ‘spot-the-difference contest’ here next week.

[Edit 24 Jan] Blog reader ‘First!’ was the first to comment and point out that the 2% recycling flow does not seem to be to scale (i.e too wide / overemphasized) in the Sankey diagram published by Ellen MacArthur Foundation, and possibly the same issue with the two arrows representing 14% each.

Food Waste in Germany

A rather simple Sankey diagram. It can be found on p. 195 of a study on Food Waste in Germany by ISWA, Stuttgart University comissioned by the Federal Ministry of Food and Agrriculture (BMEL). Flows are in million tons per year (averaged for the five-year period 2003 to 2007).


The yellow streams represent food delivered to individual housholds (“Haushalte”) as well as to commercial (large scale) users (“Grossverbraucher”) such as restaurants. The orange arrows show food waste (10 mo. tons p.a.). Note that individual households have a higher reject rate.

Yard Waste & Biowaste in Germany

What happens to yard waste and biowaste in Germany? This Sankey diagram from a 2014 PowerPoint presentation titled ‘Flächendeckender Ausbau der Biotonne in Deutschland’ by Peter Krause and Rüdiger Oetjen-Dehne (u.e.c. Berlin) shows how these flows were distributed.

In 2012 there were 14.5 mio. tonnes of yard waste andd 6.6 mi. tonnes of bio waste (kitchen/food waste) were disposed of in Germany. Much of it was collected and treated or – such as in the case of yard waste – composted (7.8 mio. tonnes).

In addition to the absolute quantities the labels along the Sankey arrows show the average per inhabitant (kg/E, a).

A large potential is still in bio waste (orange-coloured arrow) being disposed of in regular household waste (“Restabfall”). Calls for separate collection of bio waste for energy recovery are being made.