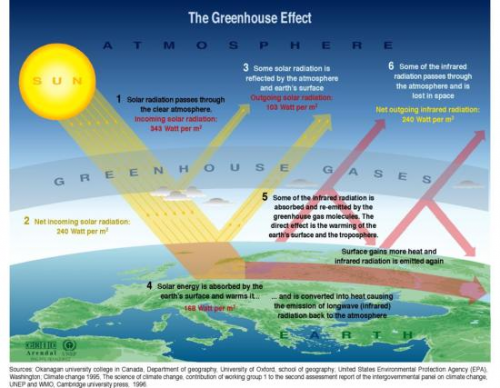
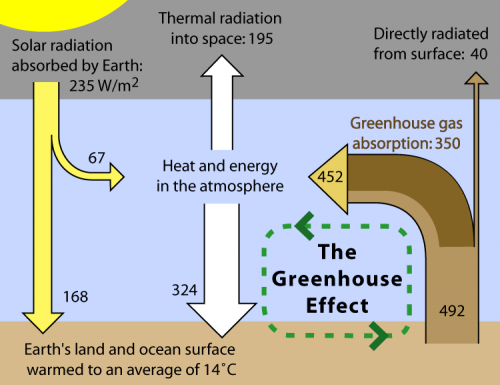
Doing a Google image search on ‘greenhouse effect’ brings up numerous versions of a diagram, that shows solar radiation partially being filtered by the atmosphere, partially hitting earth’s surface. This energy heats the earth, a part is being reflected as infrared radiation, where it is not able to escape fully due to greenhouse gas molecules from man-made emissions’ accumulated in the atmosphere.
While some of these greenhouse effect diagrams use simple arrows, some of them show the energy levels with Sankey-like arrows.
Wikipedia has one of these as an illustration for the article on the greenhouse effect. Originally designed for Global Warming Art it is also available in the Wikimedia Commons in Finnish and in Japanese.
Many of the “normal” diagrams are very appealing, and I especially like the one’s that target at kids or students. However, the diagram using Sankey arrows conveys more information. Check for yourself by comparing the two examples above.


1 Comment
This diagram is of no help
Comments are closed.