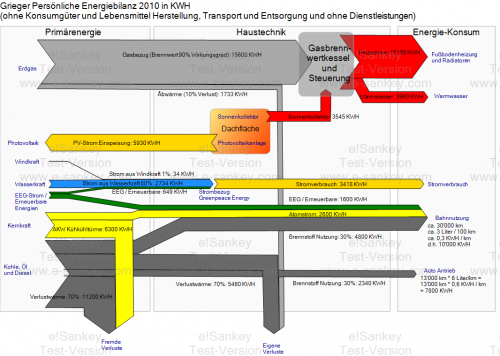
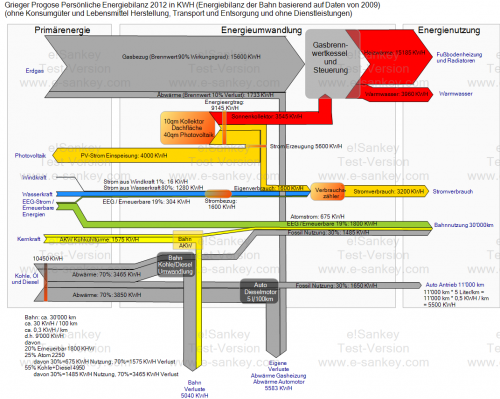
The “personal” energy balance of the Grieger family home for 2010 and a forecast for 2012 were presented in two blog posts here and here on Klaus Grieger’s blog.
All consumptions are traced back to the primary energy demand and include losses (dark rey arrows) in power generation by using efficiency factors.
2010
2012 forecast
The details of these Sankey diagrams are probably most interesting for those who understand German.
A PV system on the roof of the Grieger house permitted to feed back 5930 KWh of electric energy to the grid in 2010. In 2012 some of this energy is used directly (“Eigenverbrauch”), leading to a reduced energy bill for electricity purchased. Note that the Grieger family gets “green power” from hydro, wind and other renewables.
Another change between 2010 and 2012 is an updated mix of energies German Rail use (nuclear, coal and gas fired power plants).
Note that the two diagrams do not have the same scale. The consumption of heat is the same in 2010 and the 2012 forecast, so is primary energy demand from natural gas (grey arrow “Erdgas” at the top). Still, the 2012 Sankey arrows are wider than in the 2010 version. It would be nice to have the two Sankey diagrams side-by-side and be able to compare them by looking at the arrows widths.

