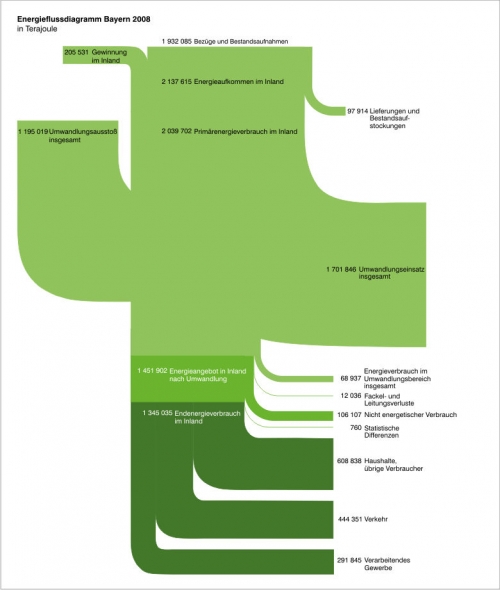
Found this Energy Flow Diagram for Bavaria (Germany) on the Bavarian Ministry of Economy website.
Flows are in Terajoule (TJ). Flows from top to bottom with different consuming sectors like private houdholds, traffic and industry. Different shades of green… 😉
While I generally welcome the fact that these Sankey diagrams are published for nations, regions or states (as is the case here / more examples can be found here on the blog!), I find that care must be taken to respect the basic principles used for these diagrams.
In that respect the above example looks somewhat quirky to me. The reason for this diagram being spoiled is the fat stream (1.195.019 TJ “Umwandlungsverluste insgesamt” – not sure what that means though) merging into the vertical band from the left, and its counterpart (1.701.846 TJ “Umwandlungseinsatz insgesamt”) branching out to the right at more or less the same height. Are these additional inputs and outputs? But then, why do they cross the main direction of the flow? Not clear to me…
Not a good example. I would have expected better from the state where two of my favourite cars are manufactured.

4 Comments
“Umwandlungsverluste insgesamt” means “total conversion losses” – I suppose caused mainly by electricity generation, but maybe including minor contributions from refineries and solid fuel production as well.
…but, reading the diagram closer, it does not say “Umwandlungsverluste” on the left, but “Umwandlungsausstoss”, so “output from transformation”.
So:
* the left stream is the “total output from transformations” (being mainly petrol products and electricity), adding to the total energy stream available, and
* the right stream is the “total input into transformations” (being mainly crude oil and the energy carriers that go into making electricity), that leave the total energy stream available.
I agree these 2 flows are not very helpful. The fraction of ‘output’ to ‘input’ would be the total transformation efficiency.
Because, however, the conversion efficiency of oil refining is so much higher than that of electricity generation (close to 100% vs 30-40%) this calculated efficiency is without meaning as long as the relative sizes of petrol and electricity generation are not known.
A total conversion losses “refers to the” total loss of transformation “- I think mainly due to the production of electricity, but possibly including minor contributions from oil refineries and production of solid fuel as well.
Comments are closed.