Graedel REE wheel Sankey remake

In this post on rare earths I have recently featured an alluvial diagram depicting rare earths use from a presentation by T.E.Graedel (Yale). That same presentation also lead me to another article by X. Du & T.E. Graedel titled ‘Uncovering the Global Life Cycles of the Rare Earths Elements’ (open access) that has a number of circular flow diagrams I would call “REE wheels”.

The article describes how quantitative data on rare earths is available for mining and processing, but “very little quantitative information is available concerning the subsequent life cycle stages”. Also, data is mostly available for the overall REE production, but not individually for every single rare earth element. They therefore aim to estimate and approximate the quantities for ten REEs, based on sources from China and Japan.

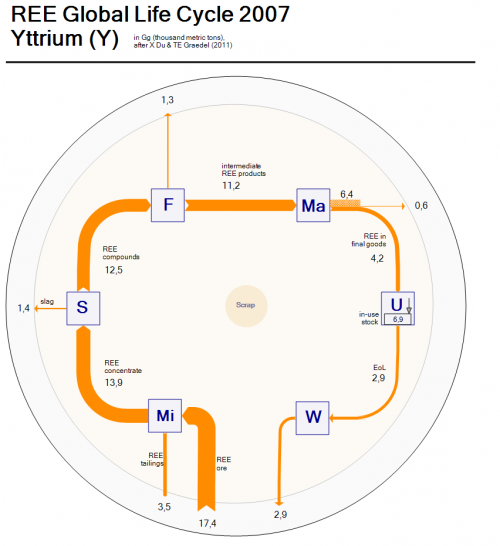
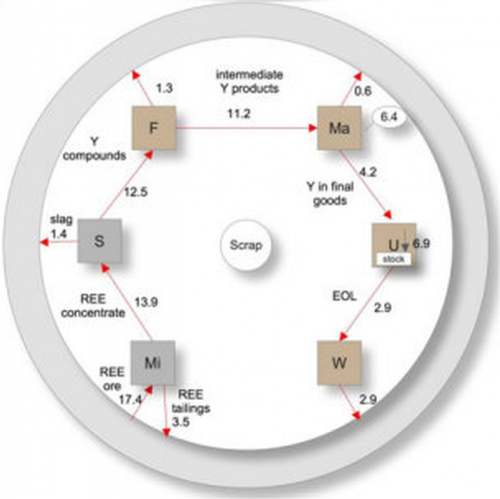
Here is the REE wheel for Yttrium (element Y) from the article:

The diagram can be read from 7 o’clock to 5 o’clock in a clockwise direction. The processing steps are “Mi” (mining), “S” (separation), “F”(fabrication), “Ma” (manufacturing), “U” (use) and “W” (waste management), thus showing the flow of the rare earth element through the economic cycle.

I did a Sankey diagram version of the above Yttrium REE wheel to have the arrow magnitude representing the quantities. Flows are in Gigagrams (million metric tons) per year.

Due to the fact that the arrows connect horizontally and vertically to the node (and do not run diagonally like in the original) my remake looks less “circular” somehow… in fact it resembles more one of those retro indoor AM/FM loop antennas you would hook to your HiFi. So I am not fully satisfied with the outcome. Would it be better if the nodes were tilted 45°?

What’s nice is that the extraction of ore (17.4 Gg) can be directly compared to the 2.9 Gg Yttrium release to the environment. I switched ore input and tailings output at the mining node to have them side-by-side.

Comments and improvement suggestions welcomed.
Visualizing Internal and External Heat Flow

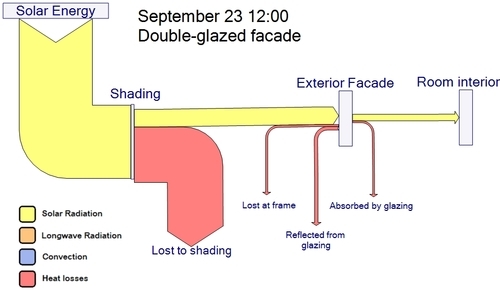
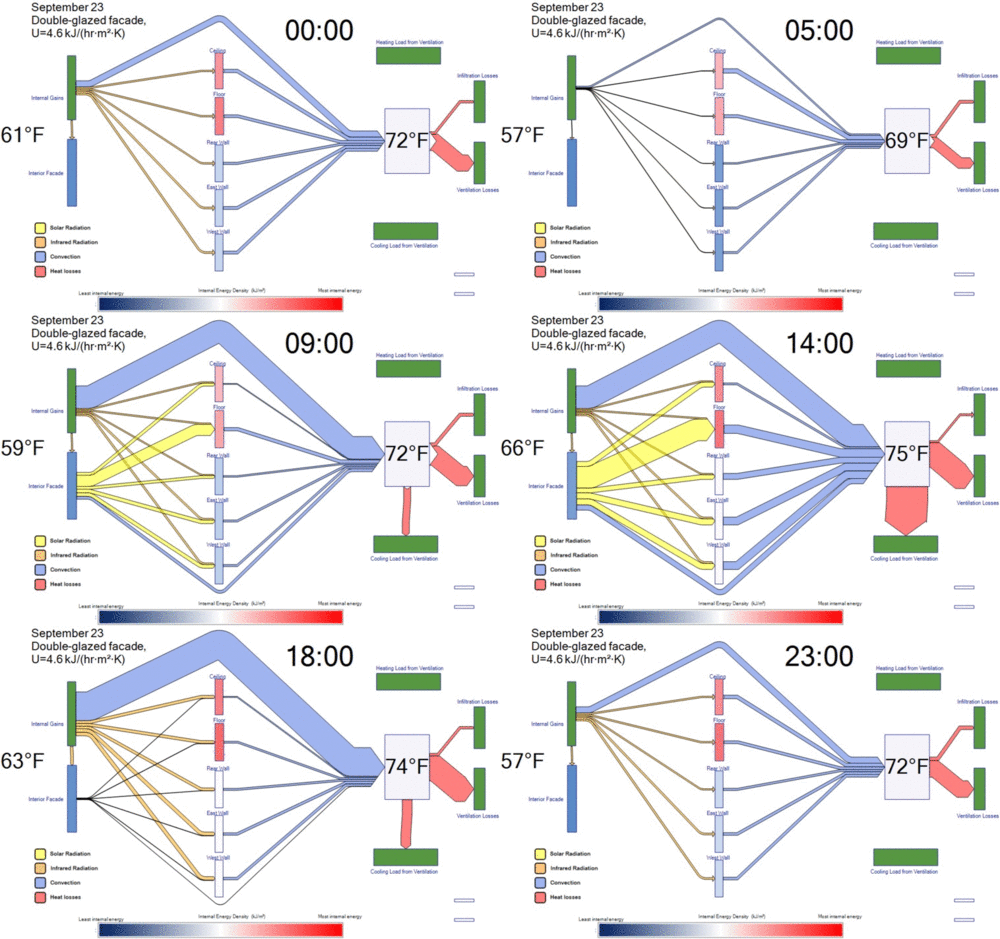
This post on the Transsolar ‘Green & Sexy’ blog features two Sankey diagrams. The “climate engineers” at Transsolar use them to model heat flows inside a building based on outside temperature and solar radiation.

No absolute values are given in these demo Sankey diagrams, but one can still get a general idea by observing proportions. Flows are color-coded with solor radiation in yellow, convection in blue, and heat losses in red.

The second Sankey diagram shown is a timeline made 24 frames – one per hour over a full-day. As the outside temperature rises and solar radiation increases around noon, the inside temperature and cooling demand increases.

(via tumblr)

Sankey diagram timeline by Transsolar

The authors explain:

“These Sankey diagrams allow us to see the proportion of how much energy is hitting the facade, how much energy is being radiated into the walls, how much energy is being convected into the air, and how much heating or cooling is actually needed to maintain an acceptable indoor air temperature. The animation is the first example we’ve ever seen of a Sankey diagram that represents the dynamic, ever-changing relationship of heat flows in a building with time.”

French Regional Energy Scenario 2050

After many national energy flow balances, some of which I have presented here on the blog, energy flow balances on a regional level are now coming out of France.

Benoît Thévard who writes on the ‘Avenir Sans Petrol’ blog (a French version of Peak Oil) has an interesting post on ‘Un scénario de transition énergétique citoyen pour la Région Centre’ (translated: An civil energy transition scenario for the Central Region). It summarizes a report published March 2015 by VEN Virage Energie Centre-Val de Loire.

The report features two Sankey diagrams. The first on page 33 is for the actual 2009 energy flows in Centre-Val de Loire (check here to find out about this French region)

Flows are in TWh. Production of nuclear energy comes with huge losses (efficiency approx. 35%). The main consumers in the region are residential and services, followed by transport. Energy consumption in industry plays a comparably smaller role in the region. The report explains that the region is vast and not densely populated and houses are older and larger on average compared to other regions (“le territoire est vaste et peu dense et les logements sont anciens et sont plus grands”). Another report mentioned on p. 21 calls the region énergívore (a beautiful word I read for the first time).

The other Sankey diagram on page 37 shows a nuclear-free and almost fossil fuel free scenario for 2050. Overall consumption is drastically reduced (2009 energy consumption approximately 75 TWh, 2050 energy consumption scenario 32,4 TWh). The scenario relies on a diversification of energy sources with an emphasis on wind energy and biogas. The region would hardly export any energy in 2050 anymore.

Just like for the India 2031 scenario I discussed in my last post, the two Sankey diagrams shouldn’t be compared directly, since the scale is different.

The report also has clear and straight-forward explanation on how to read the diagrams (page 32). This “diagramme de Sankey se lit de la gauche vers la droite, en partant des productions régionales d’énergie primaire et des importations, sur la gauche, pour aller jusqu’au consommateur final, sur la droite. L’épaisseur des traits est proportionnelle aux flux physiques exprimés en TWh.”

I think this a remarkable piece of information for the public. And not only because it contains Sankey diagrams. It is beautifully non-academic and inspiring to read. Those of you who understand French should have a look.

India Energy Flows 2031 Scenario

I have often wondered why we don’t see more Sankey diagrams coming out of India. With a population of 1.252 billion and a solid engineering education (according to AICTE 2011/2012 report: 3495 degree-granting engineering colleges in India with an annual enrollment crossing 1.2 million, 16% of Indian students take an engineering/technology course, number of graduates from technical colleges was over 700,000 in 2011) I would have expected more.

Maybe it is just because I don’t know how to read and write in Hindi, to look for the right term. This should be Sankey diagram in Hindi (please correct me if I am wrong): sankey_diagram_hindi

Anyways, the 2006 report ‘National Energy Map for India. Technology Vision 2030* published by the Office of the Principal Scientific Adviser to the Government of India (PSA/2006/3) does have a number of Sankey diagram figures.

This one shows energy flows for India in 2001

This Sankey diagram below is for one of the different scenarios for energy generation and use in India in 2031, called the ‘High energy efficiency scenario’. The stacked bar at the left is lower, but the absolute numbers for total commercial energy supply are much higher in 2031 than in 2001 in all energy scenarios, so these diagrams mustn’t be compared directly one to another.

See the appendix A5 (pp 271-278) for more Sankey diagrams for other 2031 Indian energy scenarios.

GHG Emissions of Energy from Biogas Plant

An article by Bachmaier, Hans; Effenberger, Mathias and Gronauer, Andreas in German agricultural technology publication ‘Landtechnik’ 65 (2010), no. 3, pp. 208-212 describes how “for ten agricultural biogas plants, a detailed balance of greenhouse gas emissions (GHG) and cumulated energy demand (CED) was calculated”.

Below is the Sankey diagram for plant E that has the “best GHG balance of all ten plants with net savings of 85 g CO2-eq per kWh el. Characteristics are a high share of poultry manure in the input saves energy for crop production; no additional mineral fertilizer needed; credit for surplus digested residue; high level of heat use.”

Biogas plant G has “Regular treatment of animal manure from own livestock; intermediate level of heat use; high methane emissions from CGU; high demand of fossil resources during plant operation (electricity supply from grid, fuel oil).”

Both diagrams feature the GHG emission burdens in CO2-eq per kWh electric energy produced from biogas. Upstream chains for fertilizer, diesel and electricity taken into account too. Displaced GHG emissions nonus in green. It is interesting to see that in this agricultural energy scenario methane (CH4) and nitrous oxide (N2O) are contributing to climate change in the same dimension as carbon dioxide.

Rare Earths Use, Alluvial Diagram

While brosing this presentation by Thomas E. Graedel, Yale University, Center for Industrial Ecology with the provocative title ‘Rare Earths and Other Scarce Metals: Technologically Vital but Usually Thrown Away’ I discovered the following distribution (aka alluvial) diagram. It was originally published in the article ‘Uncovering the end uses of the rare earth elements’ by X Du, TE Graedel in Science of the Total Environment, 2013 (pp. 781-784)

The diagram is best read from right-to-left: The right column shows ten rare earth elements (REE) and a node for the “other” five or seven REEs. Lanthanum (La), Cerium (Ce), and Neodymium (Nd) make up the largest portion mass-wise, followed by Praseodymium (Pr) and Yttrium (Y).

The middle column nodes (categories) represent technological uses of these REEs in e.g. magnets, automotive catalysts, or polishing powders.

The left column then represents the countries or regions where the components or products that contain REEs are produced: China, Japan, and the United States.

Data is for 2007. No mass unit or absolute numbers given for the diagram in this presentation, and I presently don’t have access to the original publication.

Du and Graedel have also published an interesting paper on ‘Uncovering the Global Life Cycles of the Rare Earths Elements’ where they analyse REE from mining to end-of-life with losses along the life cycle and display these data in a circular flow diagram for each REE. These “REE wheels” also call for a Sankey representation, but that will be for another time…

Visualizing Passenger Boarding/Alighting

I was asked if Sankey diagrams could meaningfully be used to visualize passenger loads on a tram or bus line. Here is what I came up with:

These are fictitious values. I just labeled the stops A, B, C, … and decided to go for a short feeder line. At the last stop all passengers get off (e.g. to transfer to a train).

At each stop there are passengers that get on (green) and get off (red). The number of pax on the bus is shown by the blue arrows.

The profile would probably look differently at different times of day, so depending on the data availability one would have to create diagrams for off-peak/peak hours, weekdays/holidays and so on.

Your thoughts?

Sankey diagram on Austrian Wood Industry

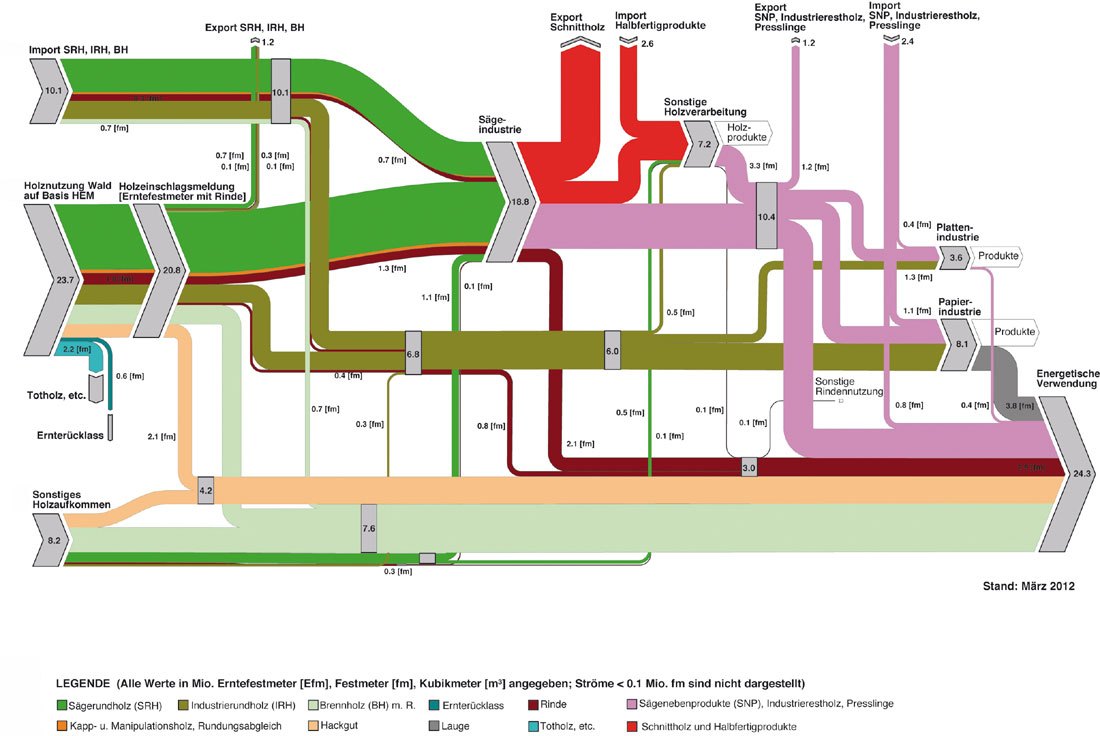
A beautifully crafted Sankey diagram on wood in Austria can be found in the 2012 article ‘Die Bedeutung von Holz als erneuerbarer Energieträger’ (translation: ‘The importance of wood as a renewable energy source’) by Kasimir Nemestóthy on the waldwissen.net website. These are the wood streams in Austria in 2010.

All streams in solid cubic metre of wood (“Festmeter”, fm). Smaller streams less than 0.1 mio solid cubic metres are not displayed.

Here is how the diagram is structured: on the left the sources of wood with imports, harvesting from forests and other non-forest wood sources. Imports and harvested wood is directed mainly to sawmills (“Sägeindustrie”) and to paper industry. Non-forest wood as well as losses from wood industry (bark, wood chips) are for energetic use.

The dark green arrow is saw round wood with the bordeaux-colored stream representing bark. The brown arrow is industrial round wood of lesser quality, mainly used in paper industry. The light pink and light green arrows represent wood chips and firewood. Along with remains from the saw mills and paper industry it is destined for energetic use.

One minor design flaw at the top (arrow from imports to saw mills) where the green arrow overlaps the orange and red arrow in the curve), but by the untrained Sankey eye this will probably rarely be noticed.

There is a second Sankey diagram in the article that details the energy use, but I will save that one for a separate post.