Tag: cost

Sam Brenner’s Sankey Diagram Generator

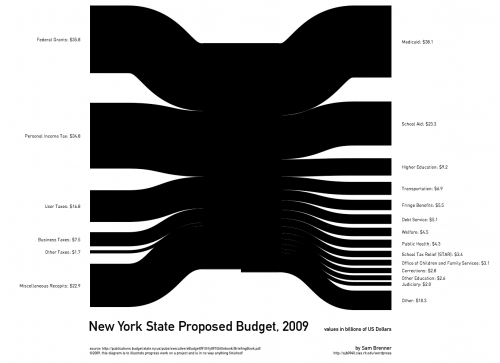
Sam Brenner, interactive design and development student at the Rochester Institute of Technology, has finished version 0.2 of his ‘Sankey Generator’ tool.

Inspired by state federal budgets Sam pursues to display financial figures in a clear and comprehensible way. Sources of state income are on the left, spendings on the right. As Sam says himself, this is still work in progress. “Iā€™m trying to make a dynamic Sankey Diagram generator (…) What I would like to end up with is a program that can take numeric data like a budget and turn it into a diagram…”.

See that small step at the bottom of the middle part? Hey, here you have the “deficit”…

Interesting new tool. Not sure if the Sankey Generator tool will reach a status that would allow Sam to release it publicly, but have added it to my Sankey software list anyway. Hope version 0.3 has some fancier colors, though šŸ˜‰

Sources and Beneficiaries of R&D Funding

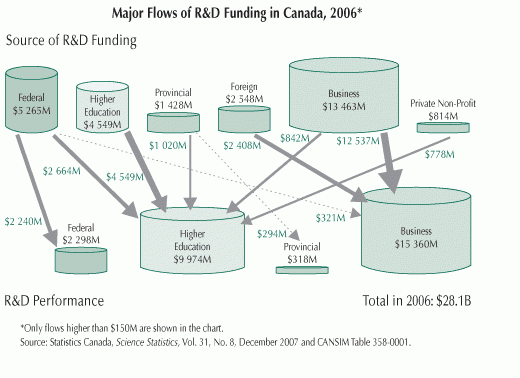
In early November I was pointed to an image on the Innovation Strategy Canada website [the website itself is not accessible any more] by a reader of this blog. Peter asked whether I know of any Sankey diagrams for financial flows, like they are shown in the one below.

The diagram visualizes the sources of R&D funding, and the institutions receiveing this funds. Data is from Statistics Canada for 2006 and shown in Mio (supposedly) Canadian Dollars.

While there are only four different arrow widths to show the financial flows, the interesting thing is that the sums of funds from each source and received by each beneficiary are shown as cylinders (database symbols, tanks, …).

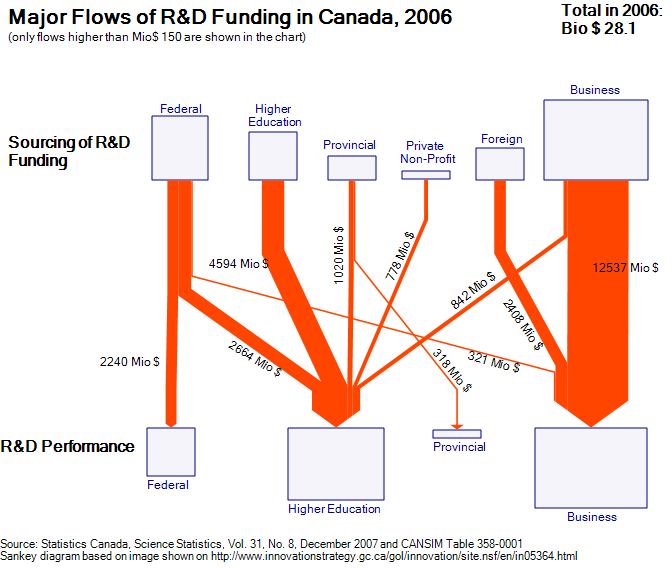
I quickly did several versions of the diagram, but was not too happy with the results. The flow quantities are OK, but as it turns out, it is difficult to see the volume of the cylinder, supposedly to scale with the sums. This information is redundant anyway, since the width of the joined arrows at their base or at their head is exactly the sum that is supposedly to be shown by the cylinder volume.

Here is one version of my Sankey diagram for R&D funding in Canada for 2006 based on the original image. I decided to make the boxes in different sizes (the problem remains the same: can one immediately grasp the area of each box).

Your comments are welcomed. Is there a better way to display the sums?

Estimated Budget Chart

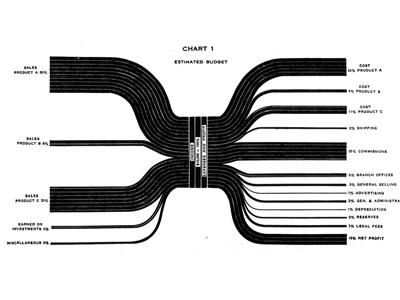
A similar Sankey-style diagram to the one I presented in my last post can be found on the visualcomplexity.com website.

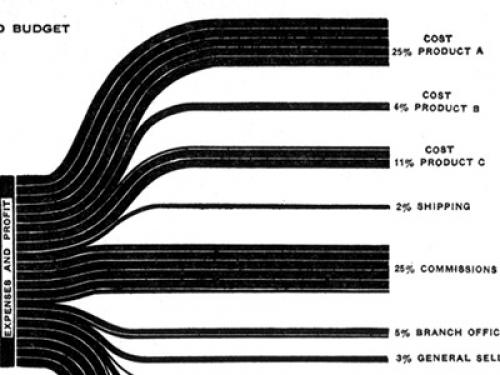
It shows the estimated budgeted costs and earnings and was published by IBM back in 1940 (original source: H. Arkin, Graphs: How to make and use them (Harper & Brothers Publishers, New York, ed. Revised, 1940).

I am not sure if this fully qualifies as a Sankey diagram, since the flows are not directional. The earnings from sales of different products are broken down into arrows of different magnitude from/to the left. Costs for producing the products and overhead costs are on the right side. This chart thus constitutes a graphical representation of an accounting system, with values given in percent rather than as absolute figures.

These distribution diagrams are also known as ‘Spaghetti diagrams’. See this detail:

Manuel Lima’s visualcomplexity website has more interesting diagrams, and one can spend hours browsing the projects. I will be presenting a few more of them that qualify as Sankey diagrams here on the blog in the future.

Monthly Household Income and Spendings

Christian Behrens from the Department of Design at Potsdam University of Applied Sciences in Germany put up a website on Information Design Patterns. It features “design patterns that describe the functional aspects of graphical components for the display, behavior and user interaction of complex infographics”.

The website is modestly called an “application prototype” of a pattern browser, and is part of his Master Thesis titled “The Form of Facts and Figures”.

All patterns are tagged and can be searched. For each type he presents a fact sheet with description, usage, required data, and rationale. Christian provides an own example for each pattern, and a “real-world example” from an external source. Additionally, related diagram types are listed.

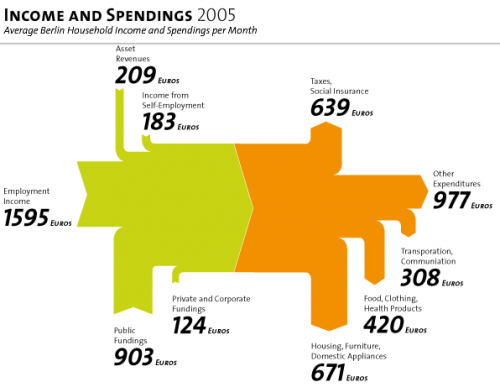
The Sankey diagram is A 5.1. The example shows the average income and spendings of a Berlin household in 2005. Salary, asset revenues and public subsidies make up for the total income, shown in green. The income is spent on taxes, housing, food, clothing and other, shown as orange arrows.

I do miss a number stating the total (3015 Euro, roughly 4500 US$) as a label for the magnitude in the middle, but nevertheless this is a superb example of information presentation with a Sankey diagram. Just try to imagine the same information shown as two pie charts…

Enjoy browsing the Information Design Patterns website.

Cost Sankey Diagrams show Added Value

While browsing through some of my older bookmarks I discovered this page of what seems to be an information portal of one of a German federal ministry. The Sankey diagram for cost flows they show reminded me of a feature in the Umberto material flow management software, which I always wanted to inspect in more detail.

Using their 30-day trial version I worked with one of the simple demo examples they provide. Basically this software is a modeling tool for process systems and analysis of material flows within any kind of process system (production plant, supply chain, region, …). Sankey diagrams in Umberto are not the default view for material flows, but one can switch from the normal “Material Flow Network” view to the Sankey view.

Even though the Sankey diagram feature of the software would need some retouching, I was surprised and extremely pleased to see a “Cost Sankey” feature.

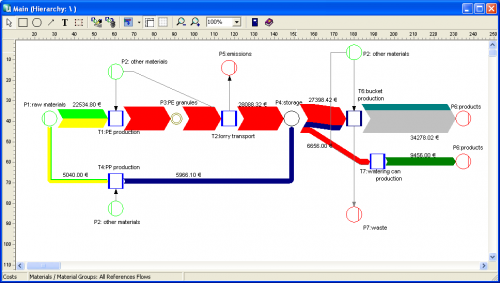
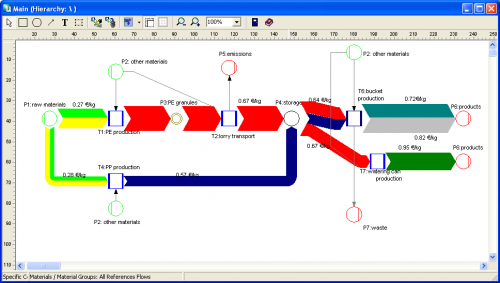
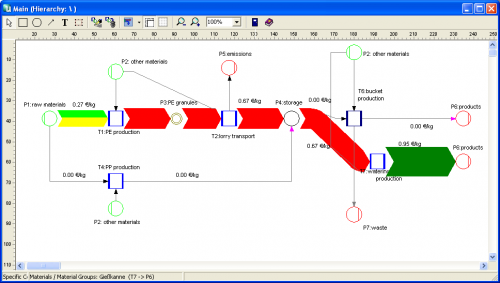
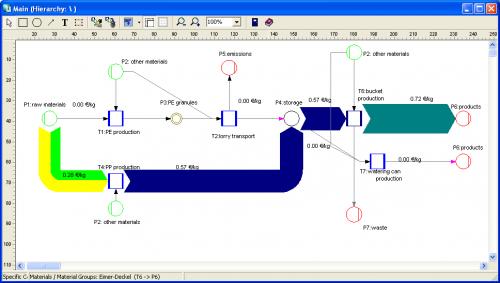
You can enter material direct cost for all materials (in the ‘bucket factory’ example of the demo all materials already have a “market price” property), as well as fixed and variable process costs. The variable process costs are spread over the process throughput using ‘machine hours’ or ‘work hours’ as cost drivers (i.e. to link cost creation to the material throughput). Thus, at every process (shown with blue squares in the flow diagram) the costs -or should I say: the value – increases. Going from left to right along the general flow direction in the Sankey diagram you can see clearly that the growing magnitude of the Sankey cost flows… a kind of ‘Value Added Sankey diagram’.


The above screenshots show the overall cost for the three products produced in the bucket factory (Fig.1), the cost per unit for each of the three products of the bucket factory (Fig.2).

The following two cost flow Sankey diagrams are for the individual costing units ‘plastic bucket’ and ‘watering can’ (Fig.3 and 4). Please note that on theses diagrams a part of the machines is not being used, so they don’t add any process costs to the costing unit (or don’t contribute to the value added). Unfortunately you can only display either mass or energy flows in one Sankey diagram, so the energy costs (from the circle labeled ‘other materials’) are not shown as a Sankey flow, even though they add to the price for each product.