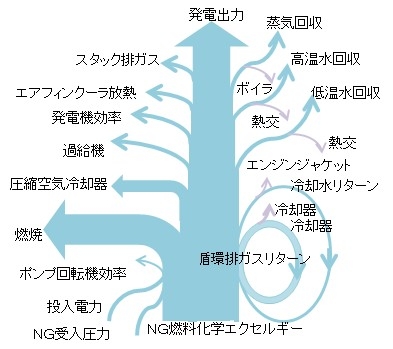
Tag: engine

Another one for Car Engine Effciency

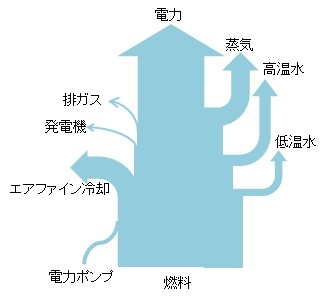
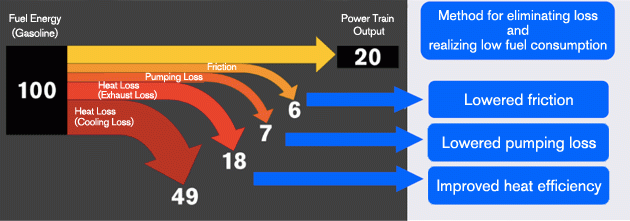
Followup to my post a few days ago on energy efficiency in an engine: Someone mentioned the below diagram that can be found on the Nissan Technology website.

Much simpler, actually a straight-forward breakout Sankey diagram. No sequencing of engine elements where power is lost as in the diagram from the Australia Gov report.
Strong emphasis on arrow heads … but worst of all flows are not to scale! 49 out of 100 should be roughly half the height of the ‘Fuel Energy’ node, but it is only 40%. Fail!

Energy Loss in Vehicle Engine

Was browsing through my bookmarks and saved images and found the below diagram. Blame it on my mood today, but this one calls for bashing.

Published in a 2010 report by Australian Government, Department of Resources, Energy and Tourism. ‘Energy Efficiency Opportunities. Energy–Mass Balance: Transport’ figure 11 on page 26 this so-called Sankey diagram looks like a aerial view of my nephews playing room with his building blocks spread on the floor… While I generally appreciate a Sankey diagram being used in a government report on energy consumption or loss in transport, I think this one is poorly executed.

If you look at the numbers you will even see that they don’t add up correctly at the ‘Motive Power’ node.

The diagram shows how energy from fuel is lost in different stages of a vehicle motor (engine, power train, transmission) with approximately 21% of the energy being used as power at the wheels. This value is just an example, and not for one specific vehicle. But 20% efficiency seems to be more or less the average in a passenger car.

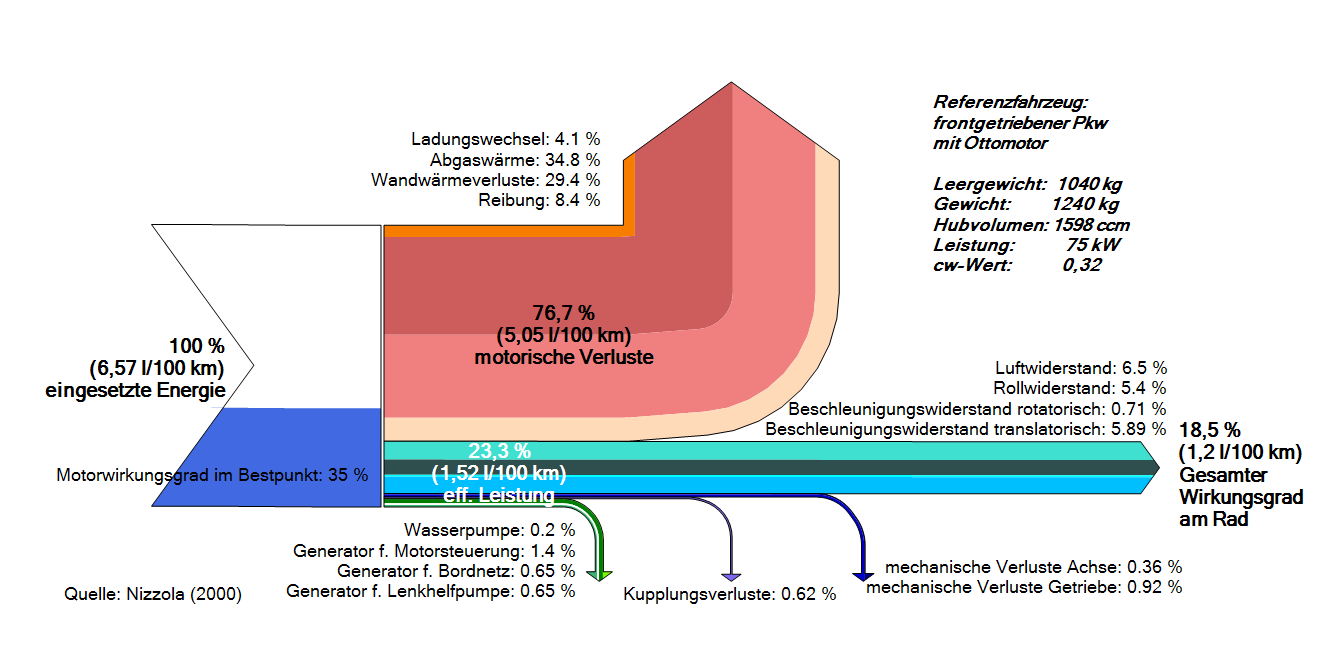
I remembered I had seen another Sankey diagram on the e!Sankey forum with the same topic.

This one is in German but you may be able to understand the main items. The red arrow are losses at the motor. The stacked turquoise-blue arrow to the right (18.5%) is energy-at-wheel. All in all there are many more details, but still the diagram remains rather “compact”.

I am sure there are more Sankey diagrams on energy losses in vehicles out there. Let me know if you find other examples to compare.
Retrofit for a Maritime Vessel Engine

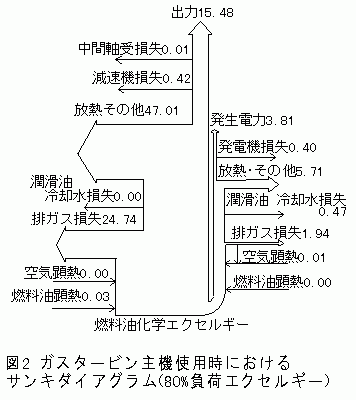
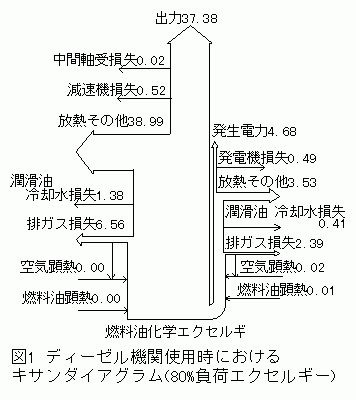
From what seems to be a 1998 abstract on retrofitting the main engine of the Japanese vessel Fukaemaru come these two Sankey diagrams. Found this on the website of the Kobe University Martime Faculty. Both nice plain black&white.

The first one shows energy efficiency of the original gas turbine equipped machine room. The base seems to be 100% energy (the label actually says ‘fuel exergy’) and the useful energy (arrow going straight up, labeled 出力) is 15.48% only. Losses branch out as arrows to the left and to the right.

The other Sankey diagram shows the energy flows for a diesel powered main engine. Efficiency is up to 37.38%

Read the full abstract here (in Japanese).

On a side note: funny to see that in the description of the figure at the bottom the author actually turned “Sankey Diagram” into a “Keysan Diagram”…

Ship engine efficiency visualized

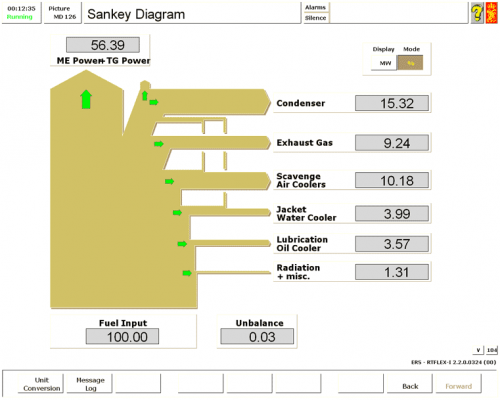
Kongsberg Maritime has developed a ship engine room simulator that also features a Sankey diagram visualization.

The Sankey diagram is a simple bottom to top breakdown of the energy contained in the fuel input. Useful energy on the power train is shown as a vertical flow to the top, while losses branch out to the right. The display can be toggled between “MW” and percent.
This visualization is one of the “approach[es] Kongsberg Maritime has towards enabling the Green Ship”.

Diesel Engine Sankey Diagram

Just back from a few days at the beach, here is just a quick one…

User BoH created a Sankey diagram for a diesel engine and uplodad it to the WikiCommons. It is in Dutch and shows the energy efficiency of the fuel being burnt in the motor.
Sankey diagram for Diesel engine (WikiCommons)
49.3% of the energy is useful energy transformed into motion, while the rest is lost. The main losses (30.45%) occur at the exhaust gases, and with cooling water (approx 10.5%).

The smaller arrows are not to scale (see the 0.76% arrow branching off on the left side compared to the one representing 1.5% (smeeroliekoeling, cooling of lubricant oil)). Also, I am not sure whether the author forgot an arrow at the blue node labeled “Lucht” (air).

Anyway, apart from these flaws it is a neat diagram. I particularly like the color gradient from ‘red hot’ to ‘cool green’.

Efficiency Diagram for Ship Engines

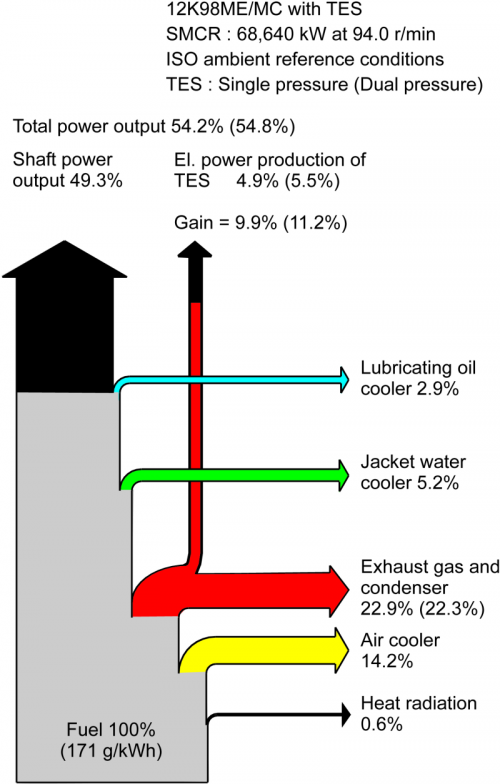
MAN Diesel, a renown producer of marine and power plant diesel engines, has been working on improving fuel efficiency of its engines. Today, the fuel energy efficiency is about 50%. The MAN Turbo Efficiency System (TES) allows to recover of heat from the exhaust gas, which is responsible for about 50% of the energy losses.

Here is a Sankey diagram that shows the recovery of energy from exhaust gas.


Download a description of the TES here (PDF, 291 KB)
or view a high resolution version of the above Sankey diagram from their press picture gallery.

Engine Efficiency of Cars

The U.S. Department of Energy (DOE) is funding research projects that target the increase of efficiency of car engine.

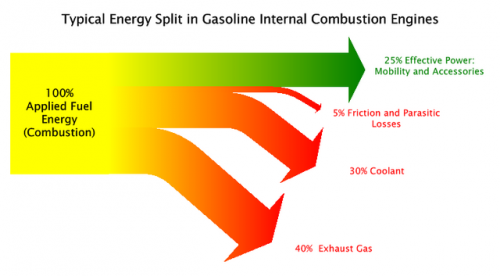
The Sankey diagram shown in this post on the Green Car Congress blog visualizes that only 25% (green arrow) of the energy from combustion is used as “effective power” for mobility and accessories, while 40% of the energy is lost in exhaust gas.

Projects are being carried out at John Deere, Caterpillar, Detroit Diesel and Mack Trucks, to name just a few.

“Seven of the twelve projects focus on advanced combustion technology with a heavy focus on HCCI (Homogeneous Charge Compression Ignition). There is also an diesel-compressed-air hybrid truck powertrain under development. The remaining projects deal with technologies to convert waste heat from engines to electrical or mechanical energy.”

The inefficient energy use of car engines and other vehicles are the main reason for the transport sector being (next to energy generation and transmission) the sector where most energy is being lost (see this post).