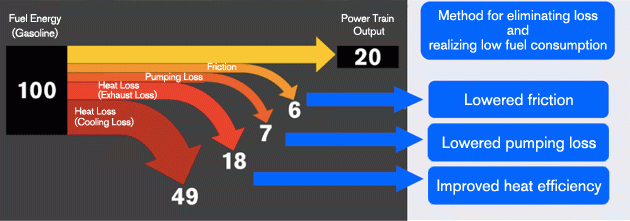
Followup to my post a few days ago on energy efficiency in an engine: Someone mentioned the below diagram that can be found on the Nissan Technology website.
Much simpler, actually a straight-forward breakout Sankey diagram. No sequencing of engine elements where power is lost as in the diagram from the Australia Gov report.
Strong emphasis on arrow heads … but worst of all flows are not to scale! 49 out of 100 should be roughly half the height of the ‘Fuel Energy’ node, but it is only 40%. Fail!
