Tag: plastics

Circular Economy Roadmap Australia

CSIRO, Australia’s national science research agency, recently released a report “Circular economy roadmap for plastics, glass, paper and tyres. Pathways for unlocking future growth opportunities for Australia”. It looks at “a circular economy, with an objective of reducing total waste generated in Australia by 10 per cent per person by 2030”.

For each of the consumer products mentioned in the title it presents the current situation, and a 2030 circularity scenario as a Sankey diagram. Here is the one for plastics in Australia 2018 and 2030.

Flows are in million tonnes. In 2018 only 4% of plastics were recycled. This is projected to increase to 50% in a circular economy scenario, even with a slight overall increase in annual plastic use from 3.41 Mt to 3.76 Mt.

Read more here and download the summary report.

European Plastics Packaging Waste Study

Deloitte Sustainability in a 2017 report titled ‘Blueprint for plastics packaging waste: Quality sorting & recycling’ showed the results of “a quantitative and a qualitative analysis of the main packaging resins (PET, HDPE, LDPE, PP) based on the flows in France, Germany, Italy, Spain and the UK, which represent 70% of the plastic waste generated in Europe”.

The plastic waste streams for the year 2014 are shown as a Sankey diagram on page 16.


The collection rate that year on a European average was at 37% and the recycling rate at 13%. Most of the packaging waste goes to incineration and landfill.

The study also looks at improvement potential in plastics waste collection and recycling. The plastic packaging waste streams for a possible 2025 scenario with a collection rate of 74% and a recycling rate of 55% is also shown as Sankey diagram for comparison.

U.S. Plastic Waste Streams

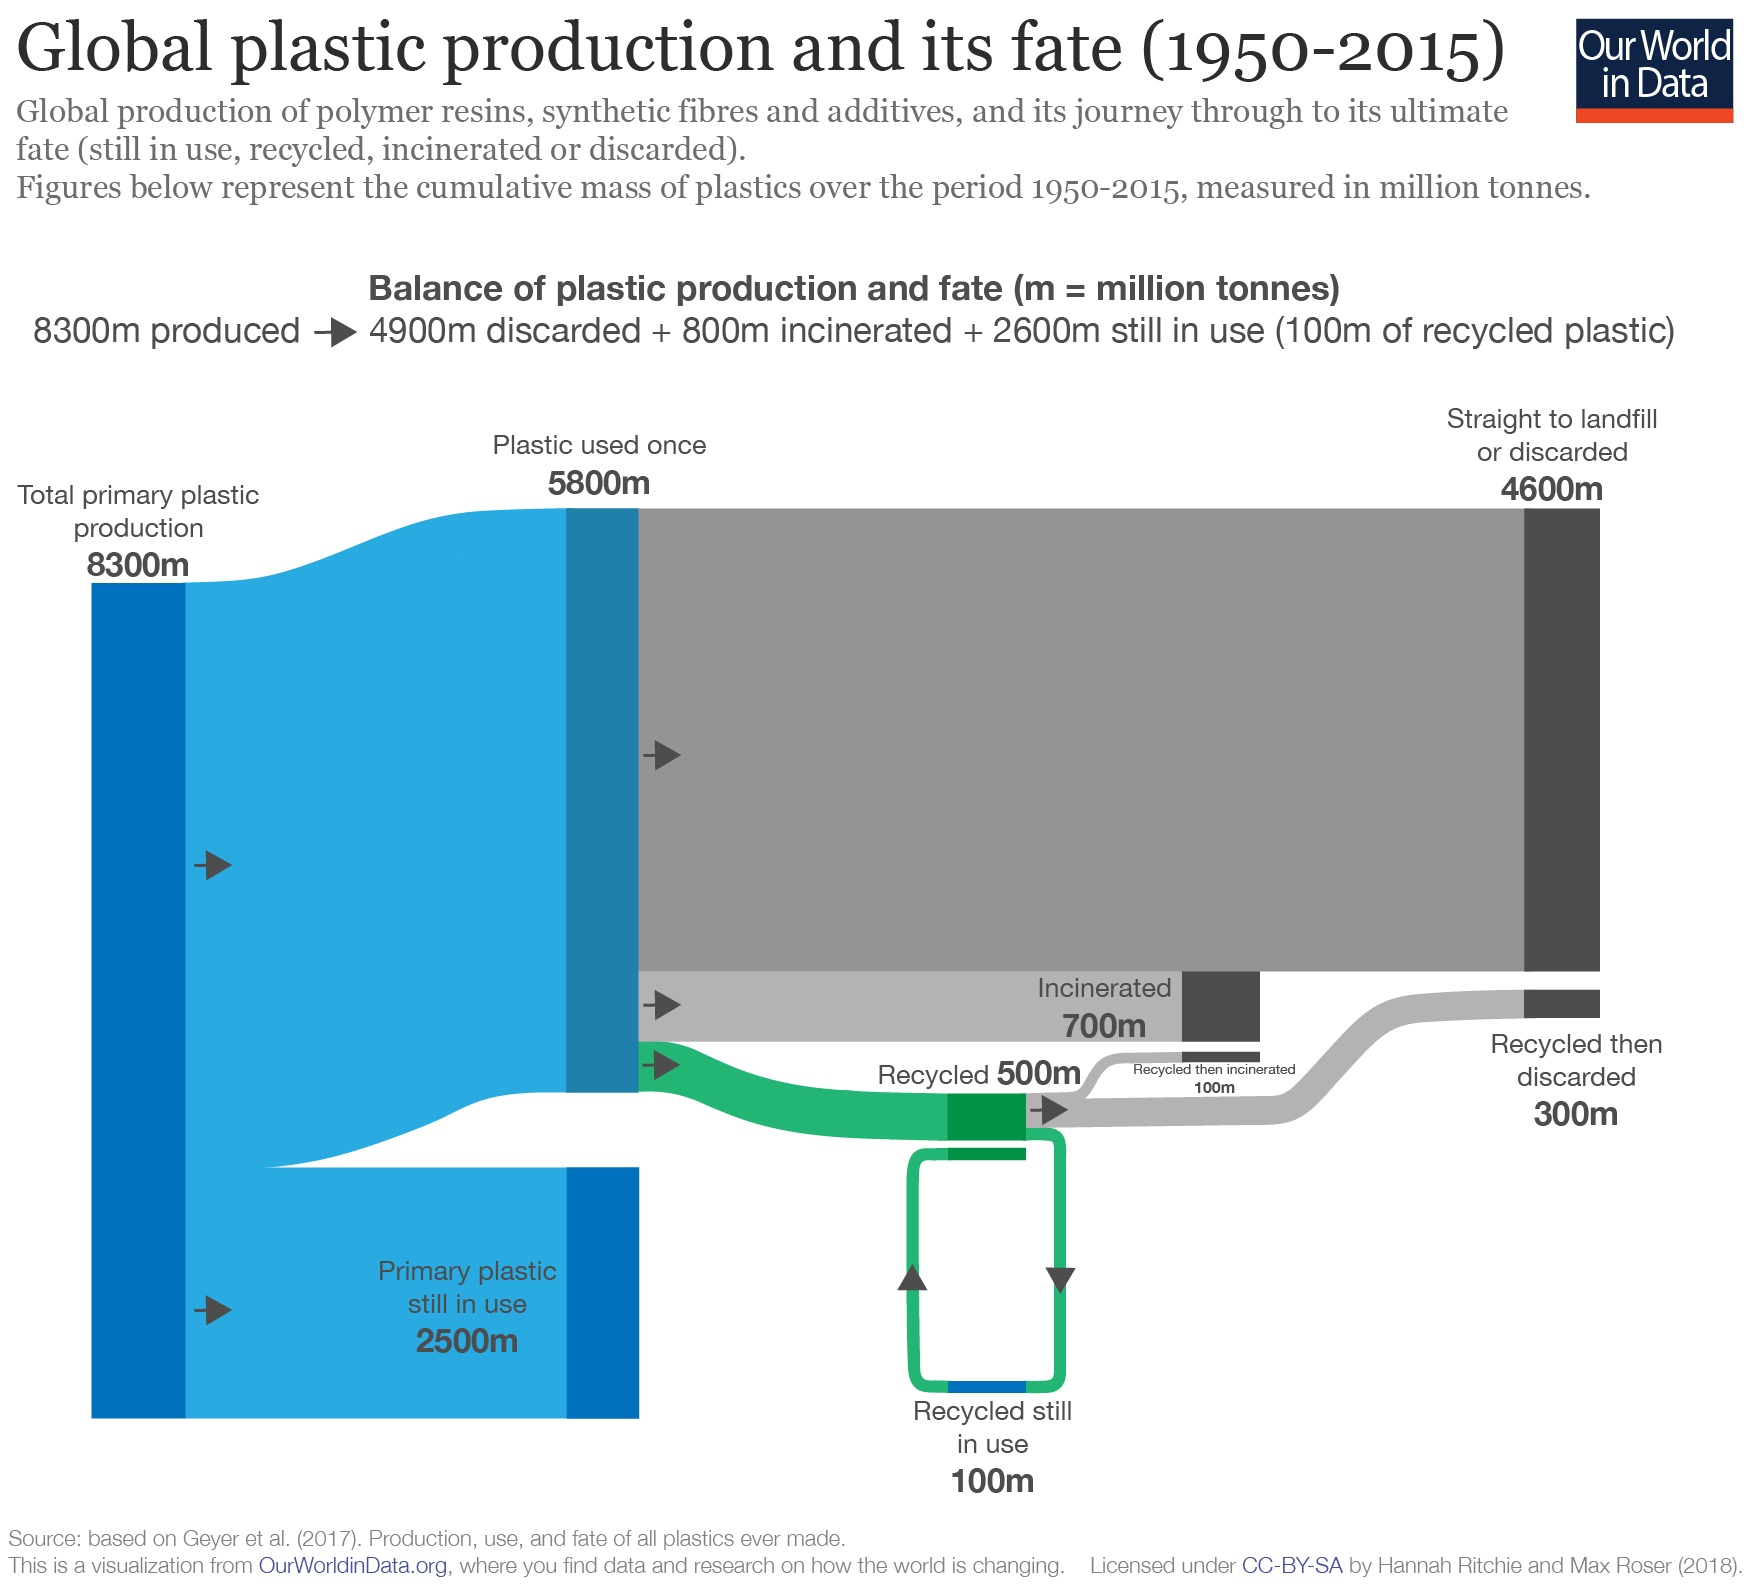
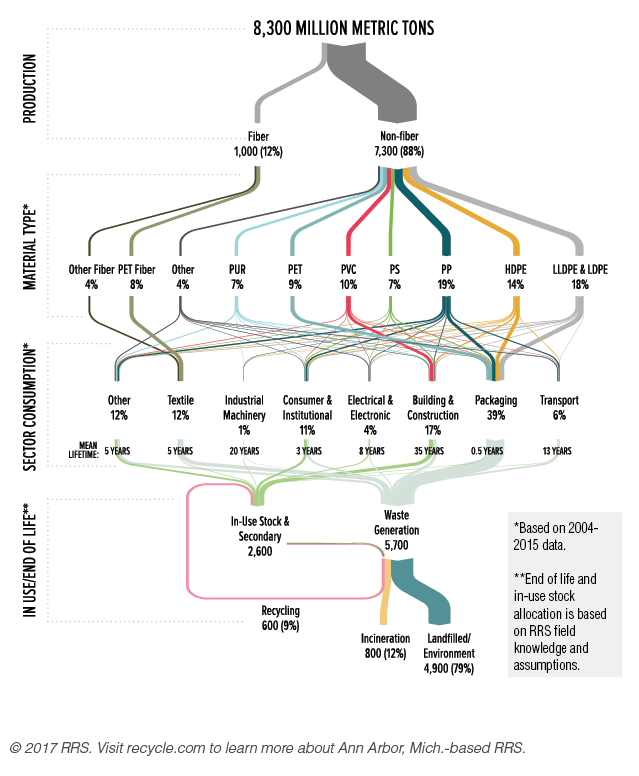
Ann Arbor based consulting firm RRS has published a Sankey diagam visualization of the plastic streams in the United States. This is from their Data Corner blog.

Breakdown is in percentage values only. The amount of 8,300 MMT seems to be an aggregated figure for a 65 year period from 1950 to 2015. And 80% has ended up on landfills.

Original data is from a study ‘Production, Use, and Fate of All Plastics Ever Made’ authored by Roland Geyer of the University of California, Santa Barbara; Jenna Jambeck of the University of Georgia; and Kara Law from the Sea Education Association.

Global Plastics, Ellen MacArthur Foundation

This week the global plastics flows topic made the news and social media with the publication of the EU Plastics Strategy and Chancellor Philip Hammond presenting the United Kingdom’s plan for tackling plastic waste.

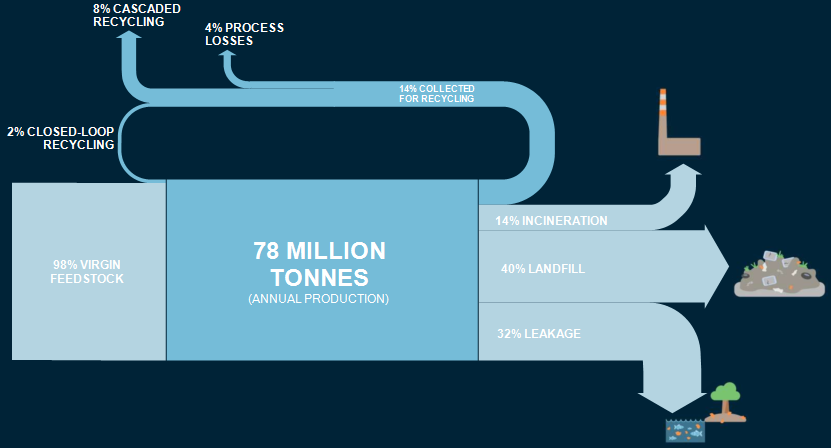
Ellen MacArthur Foundation has long been active in research and awareness building in this field. It aims at supporting a transition to a circular economy. The foundation tweeting under @circulareconomy contributed this Sankey diagram. It is from a 2016 report they produced together with the World Economic Forum and McKinsey.

The Sankey diagram shows indeed, that “today, plastic packaging material flows are largely linear”. This beautifully crafted diagram had already caught my attention back in 2016 when I first saw it.

However, I had this subtle feeling that something was wrong here. Not regarding the content or the data … but rather that something wasn’t OK in the Sankey diagram, Just my gut feeling. Now, seeing the Sankey diagram again in the above tweet this week, I finally sat to quickly do a remake of this Sankey diagram. Here it is:

I stuck to the original layout and design as closely as possible, using the same color codes and even the white all caps font. While transfering the numbers (all percentage values, so no issue there), it immediately became clear to me what caused my irritation. Can you identify it yourself by comparing the two pics?

Won’t give it away now and wait for your comments. Will post the answers to this small ‘spot-the-difference contest’ here next week.

[Edit 24 Jan] Blog reader ‘First!’ was the first to comment and point out that the 2% recycling flow does not seem to be to scale (i.e too wide / overemphasized) in the Sankey diagram published by Ellen MacArthur Foundation, and possibly the same issue with the two arrows representing 14% each.
World Petrochemical Balance, Sankey

The International Energy Agency (IEA) is a good source for reports on energy, both with a focus on global energy, but also breaking it down to the national level. I have featured their Sankey diagram website that allows to access national energy balances for many countries in this post back in 2013.

Browsing through their reports also sometimes reveals Sankey diagram gems. In their report on ‘Tracking Industrial Energy Efficiency and CO2 Emissions’, however, I found the diagrams on aluminium, steel, pulp/paper and petroleum not particularly sexy.

This is a schematic block diagram. Arrows are labeled with the quantity in Mt/year.

I decided to redo this as a Sankey diagram, maintaining the general structure of the original diagram. The width of the Sankey arrows immediately exhibit where most of the mass (crude oil) is…

I chose three colors: blue for the actual products from petrochemical industry, yellow for recycling streams and losses, purple for the precurors or feedstock (I actually thought I should do away with these, since the ‘hydrogen energy’ flow gave me some headache…). Also decided that the head of the arrow representing 115 Mt/year of post-consumer waste leading towards (!) net additions to stock in the original diagram is erroneous and thus turned the arrow around.

Didn’t spend much time on graphic aspects or fine tuning. I am sure this can be done quite nicely. But even like this I think a Sankey diagram is the better way to get the message across.

PET flows in the US

Polyethylene terephthalate is something everyone of us uses almost every day. Better known by its acronym PET it is used for plastic film and soft drink bottles.

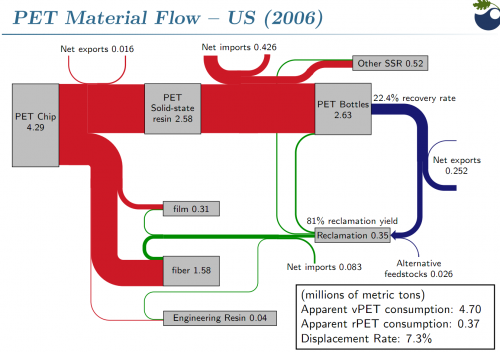
The following Sankey diagram is from a presentation on PET beverage bottle recycling by Brandon Kuczenski and Roland Geyer of Donald Bren School of Environmental Science and Management at the University of California, Santa Barbara. It was held on the First Symposium on Industrial Ecology for Young Professionals (SIEYP) in Tempe, AZ on May 17, 2009.

The Sankey diagram shows PET flows in million metric tons in the U.S. in 2006. 4.29 mio tons of pet flakes are being produced, of which 2.63 mio tons are transformed into PET bottles (other products are PET film and PET fiber). Only 22.4% of these bottles could be recovered after use. This “loss” is being represented by the blue flow which has only a fourth to a fifth of the width of the red entry flow. Recovered PET bottles are exported or reclaimed, closing the loop at least for a fraction of the PET flows.

Interesting Sankey diagram. Congratulations to Kuczenski/Geyer for visualizing this so clearly. Your comments appreciated