Polyethylene terephthalate is something everyone of us uses almost every day. Better known by its acronym PET it is used for plastic film and soft drink bottles.
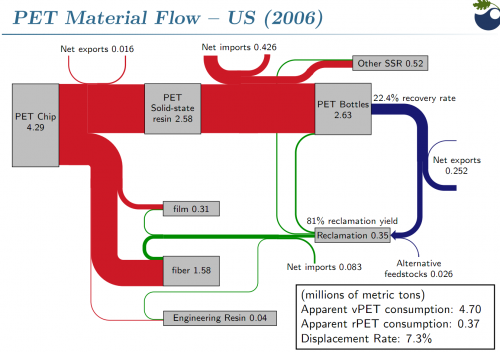
The following Sankey diagram is from a presentation on PET beverage bottle recycling by Brandon Kuczenski and Roland Geyer of Donald Bren School of Environmental Science and Management at the University of California, Santa Barbara. It was held on the First Symposium on Industrial Ecology for Young Professionals (SIEYP) in Tempe, AZ on May 17, 2009.
The Sankey diagram shows PET flows in million metric tons in the U.S. in 2006. 4.29 mio tons of pet flakes are being produced, of which 2.63 mio tons are transformed into PET bottles (other products are PET film and PET fiber). Only 22.4% of these bottles could be recovered after use. This “loss” is being represented by the blue flow which has only a fourth to a fifth of the width of the red entry flow. Recovered PET bottles are exported or reclaimed, closing the loop at least for a fraction of the PET flows.
Interesting Sankey diagram. Congratulations to Kuczenski/Geyer for visualizing this so clearly. Your comments appreciated

2 Comments
Seems like there ought to be a stream showing how much goes to the landfill or otherwise into the environment. The red stream can’t just go to PET bottles and stop… the bottles go somewhere. And if they’re not recovered, where else might they be?
@Ben: I agree. Typically you would have a flow “losses” or “not recovered” (with a width representing the difference) that would branch off a the output side of the “PET bottles” node.
Comments are closed.