Tag: recycling

Household Packaging Waste Recycling

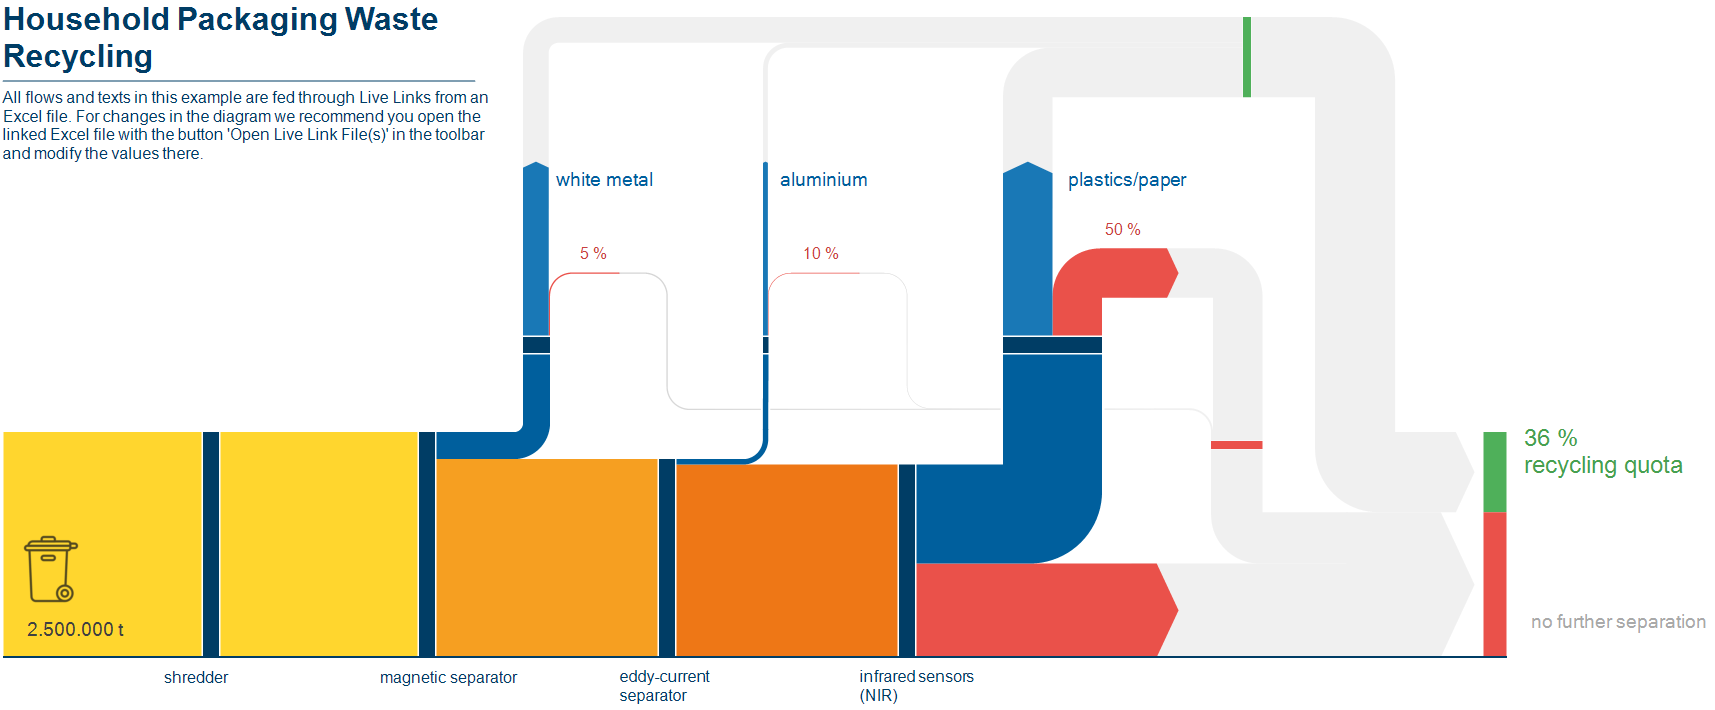
This Sankey diagram on recycling of household packaging waste is one of the sample files shipped with the new e!Sankey software release.


The overall household waste collected passes several processing/recovery steps where white metal, aluminium, plastics and paper are separated from the stream. These recovered materials add up to 36% recycled material.

Values seem to be fictitious, and flows are fed from an Excel spreadsheet, where you can modify the recovery quota for each material. The Sankey diagram reacts to values changing and updates the arrows accordingly. Nice !
Textile Flows in the United States

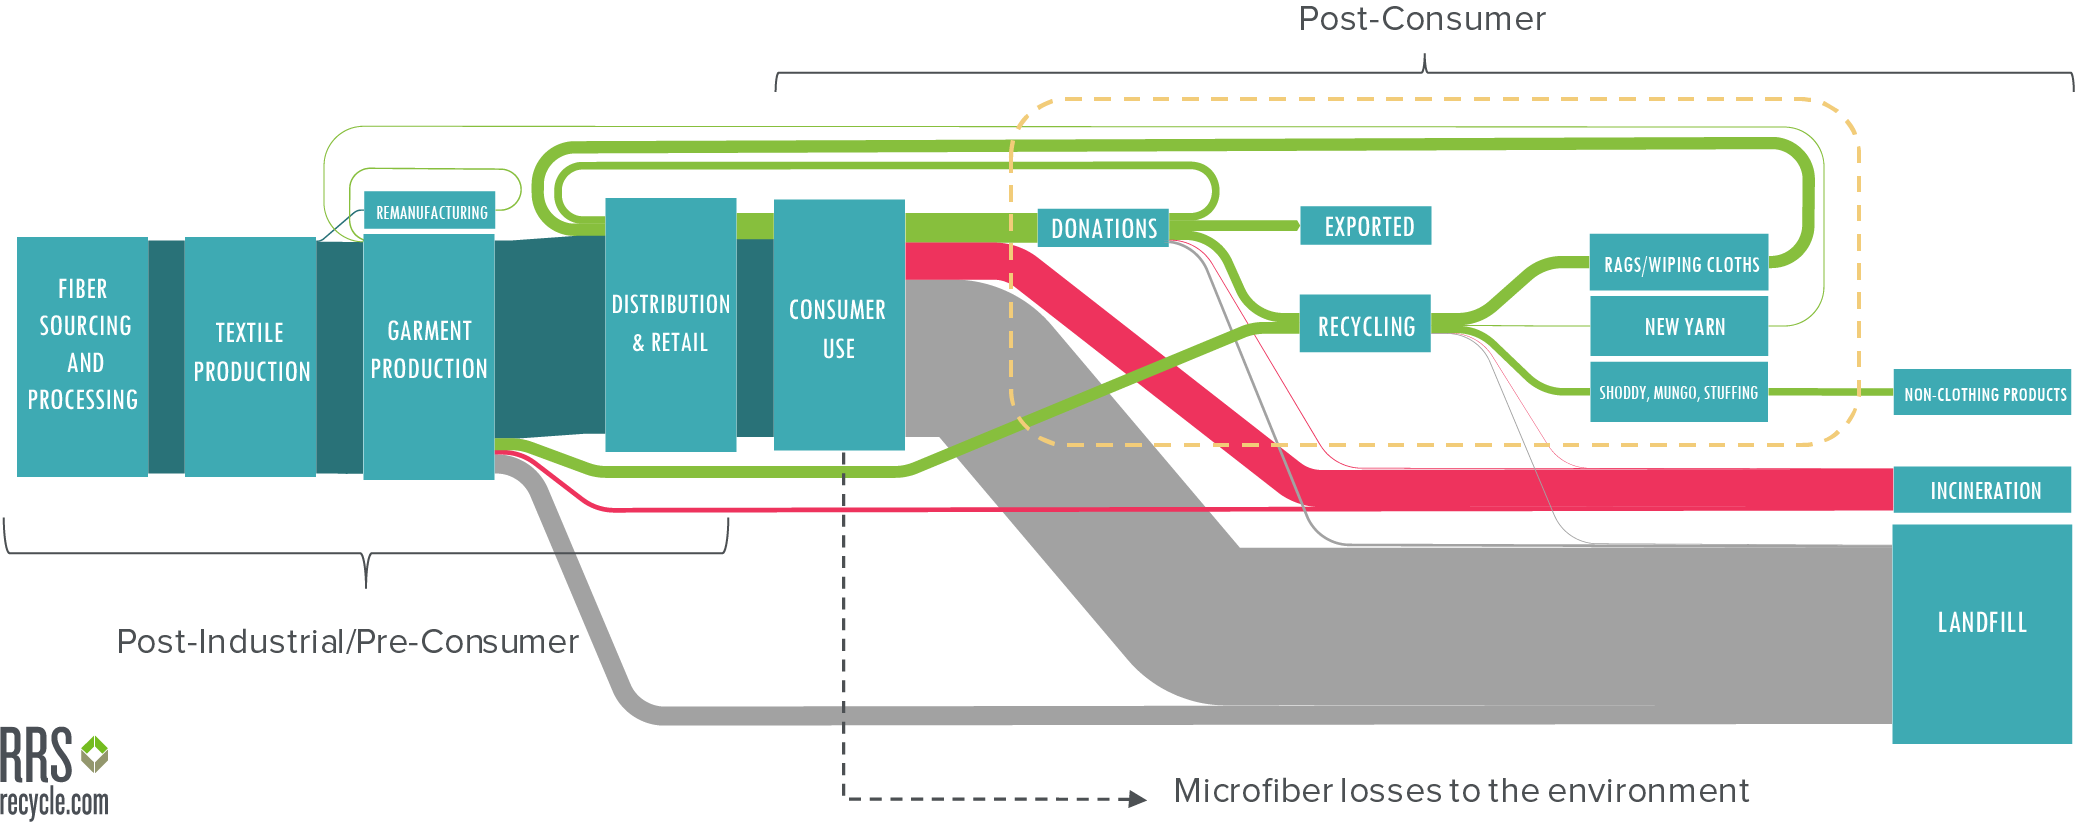
RRS, a consulting firm with expertise in waste reduction, life cycle management and applied sustainable design has this Sankey diagram on textile streams in the US garment industry.


While the figure doesn’t show any numbers explicitly (which I am sure exist, and were used to set up this schematic Sankey diagram), the idea is to show existing alternative paths for post-consumer textile use. Green flows are recycle, reuse and repurpose, while red streams are to incineration. The largest stream is to landfills. RRS is developing ideas and helping to change the material flows in the textile sector to be more environmentally friendly.

Misc Sankey Diagrams Uncommented 14

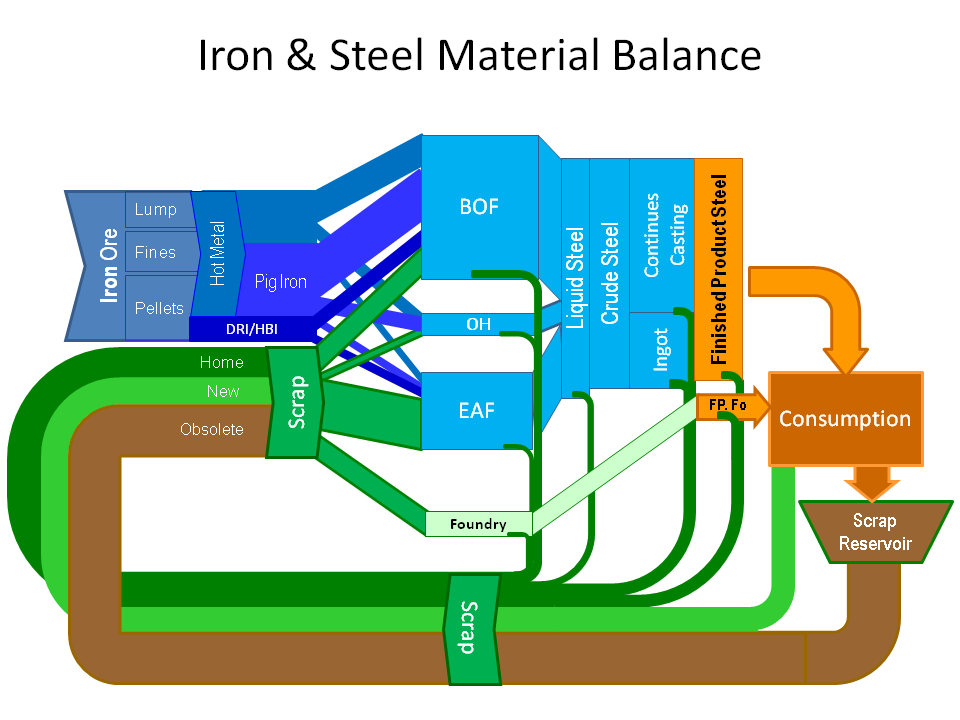
Digging through some long untouched folders on my hard disk, I found this schematic Sankey diagram of iron and steel flows.


Schematic? Well, no quantities or units given, no time reference, no source of data. And no idea as to who the author is. Just take it as another miscellaneous Sankey diagram.

PET flows in the US

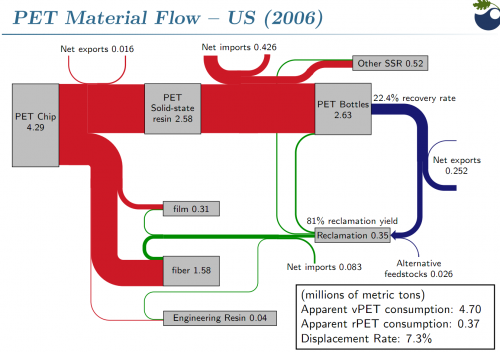
Polyethylene terephthalate is something everyone of us uses almost every day. Better known by its acronym PET it is used for plastic film and soft drink bottles.

The following Sankey diagram is from a presentation on PET beverage bottle recycling by Brandon Kuczenski and Roland Geyer of Donald Bren School of Environmental Science and Management at the University of California, Santa Barbara. It was held on the First Symposium on Industrial Ecology for Young Professionals (SIEYP) in Tempe, AZ on May 17, 2009.

The Sankey diagram shows PET flows in million metric tons in the U.S. in 2006. 4.29 mio tons of pet flakes are being produced, of which 2.63 mio tons are transformed into PET bottles (other products are PET film and PET fiber). Only 22.4% of these bottles could be recovered after use. This “loss” is being represented by the blue flow which has only a fourth to a fifth of the width of the red entry flow. Recovered PET bottles are exported or reclaimed, closing the loop at least for a fraction of the PET flows.

Interesting Sankey diagram. Congratulations to Kuczenski/Geyer for visualizing this so clearly. Your comments appreciated