Tag: transport

1913 public transport 3D map

Leafing through Brinton’s 1914 book ‘Graphic methods for presenting facts’ I found this example of a 3D map that has elements of a Sankey diagram.

This map (photo taken from an exhibit at a 1913 exhibition) shows passenger numbers on the Frankfurt streetcar lines (back then when trams were still called streetcars!)


Brinton explains that “we have a map presentation in which quantities are represented by building vertically above the various routes laid out on the map … made by strips of wood, alternately black and white, glued carefully above each one of the street-car routes. Each of the strips of wood represents 4,000 passengers carried on the street-car lines in 24 hours” (page 224).

The built up flows showing passenger numbers would, if laid sideways, indeed make a Sankey diagram. Building them up using the third map dimension avoids the issue of dealing with wide Sankey arrows in a dense city center, where passenger numbers are highest.

Brinton’s book, although over 105 years from its publication still makes for a great read (as does his 1939 book on ‘Graphic Presentation’, which is basically a sample book for doing infographics).
Aircraft Crashes Cause/Phase Relationship

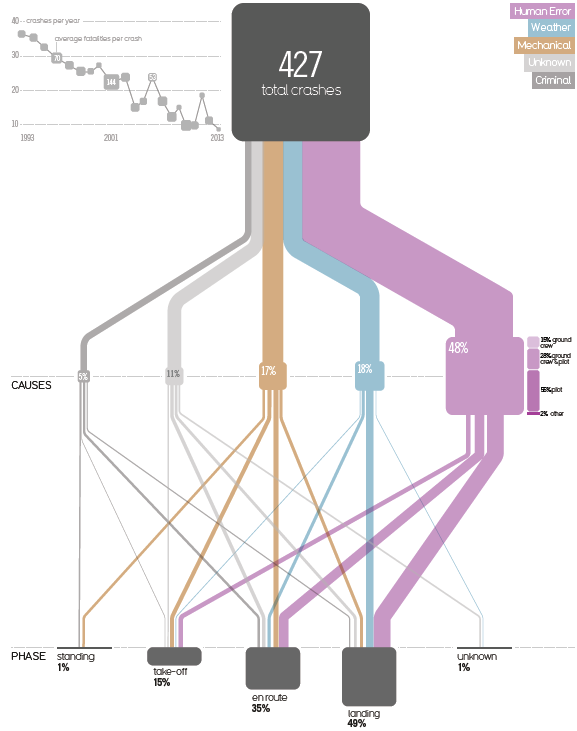
This one is from a very interesting 2015 blog post titled ‘Visualizing the causes of airline crashes’ by Rick Wicklin on the SAS blog.

The original graphic discussed is from David McCandless’ book ‘Knowledge is Beautiful’. Wicklin, a researcher in computational statistics at SAS has praise for the beauty of McCandless’ infographics, but criticizes the use of a Sankey diagram, points to two main issues with the diagram, and suggests to instead use a mosaic plot to convey the message.

The underlying data is for the time frame 1993 to 2013. The 427 aircraft crashes in that period are broken down in two categories: the cause of the crash (human, mechanical, weather, criminal) and the phase of flight when the crash occured (landing, en route, take off, standing on ground).

In addition to the width of the bands linking the nodes, the size of the nodes themselves are used to represent a percentage share. (This is BTW one of the problems that Wicklin identifies, read more here).

The inset at the top left should also be mentioned, as it shows that the absolute number of aircraft crashes over two decades has a downward trend… maybe a consolation to those that who are afraid of flying…

Nordic Transport Energy in 2050

The report ‘Nordic Energy Technology Perspectives 2016’ published by IEA looks at energy scenarios for Northern Europe / Scandinavia and pathways to carbon-neutrality. Several Sankey diagrams are included in this extensive study.

These are the energy flows in the nordic countries caused by transport. The first Sankey diagram is for the current situation (data from 2015), the second for a 2050 carbon-neutral scenario (CNS).


© OECD/IEA 2016 Nordic Energy Technology Perspectives 2016, IEA Publishing. Licence: www.iea.org/t&c

In the 2050 scenario we see a massive shift from diesel and gasoline powered transport to biofuels and electricity. This ambitious target could be achieved with “fuel efficiency improvements on existing technologies but also rapid penetration of alternative drivetrain technologies such as hybrids and electric vehicles” (p. 66).

Check out the full report here.

Spendings on Energy Efficiency Measures

This is quite an interesting Sankey diagram from the World Energy Outlook 2014. It visualizes international spending on energy efficiency measures in the transport sector under a hypothetical ‘New Policies Scenario’.

A total of 14.5 trillion US$ would be spent until 2040 to improve energy efficiency in the transport sector. The largest chunk (37%, 5.3 trillion US$) on improving private cars. This amount is further broken down to four geographic regions. The money would be spent mainly on improving the power train, and on development of light-weight components.

The underlying scenarios are described in detail at the beginning of the WEO-2014 study. The authors point out that “[f]or each scenario, we offer a set of internally consistent projections to 2040. None should be considered forecasts.”

“The New Policies Scenario is the central scenario of WEO-2014. It takes into account the policies and implementing measures affecting energy markets that had been adopted as of mid-2014, together with relevant policy proposals, even though specific measures needed to put them into effect have yet to be fully developed. These proposals include targets and programmes to support renewable energy, energy efficiency, and alternative fuels and vehicles, as well as commitments to reduce carbon emissions, reform energy subsidies and expand or phase out nuclear power.”

Recovering Energy of Train Braking

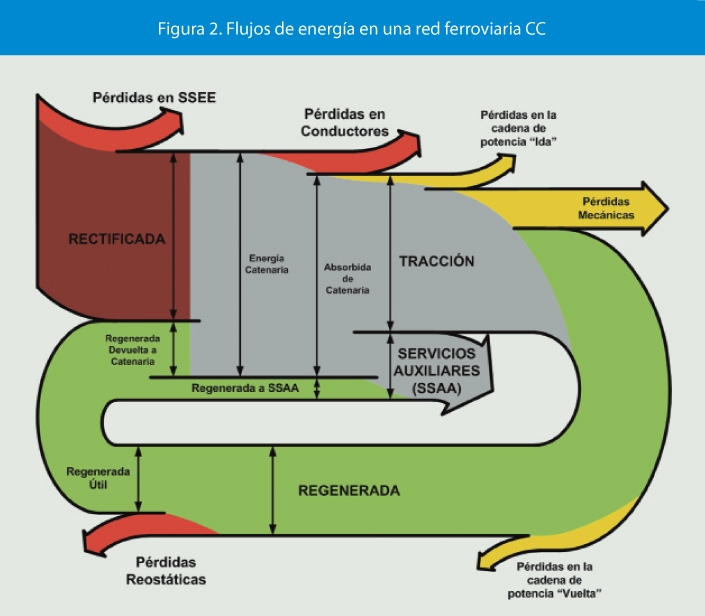
The article ‘Aprovechamiento de la energía procedente del frenado regenerativo en ferrocarriles metropolitanos’ by Álvaro López López published in the Spanish journal ‘Anales de Mecánica y Electricidad (May/June 2013)’, pp 12-18 has the following Sankey diagram.

No absolute numbers are given here. Still, we understand that from the motion energy during braking of the train a part (green flow) can be recovered and is being used for secondary systems (‘SSAA’) as well as being fed back into the overhead wire (‘cantenaria’).

Not sure though whether this Sankey diagram is a representation of the energy recovery during braking action only, or of the energy flows on a typical train ride.

South China Sea Oil/LNG Transport

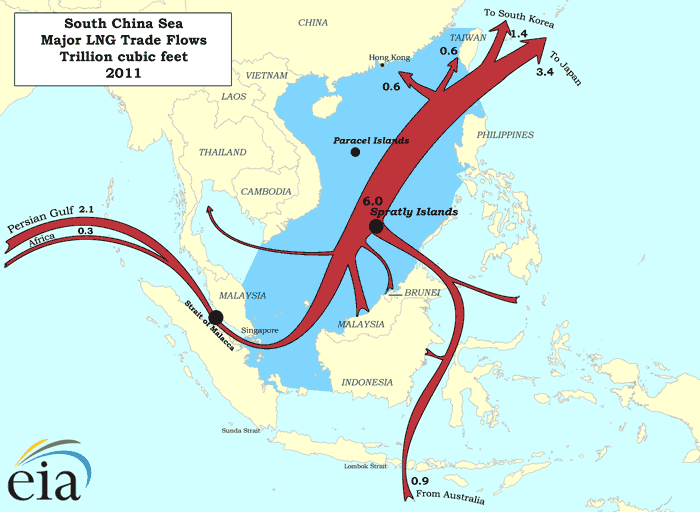
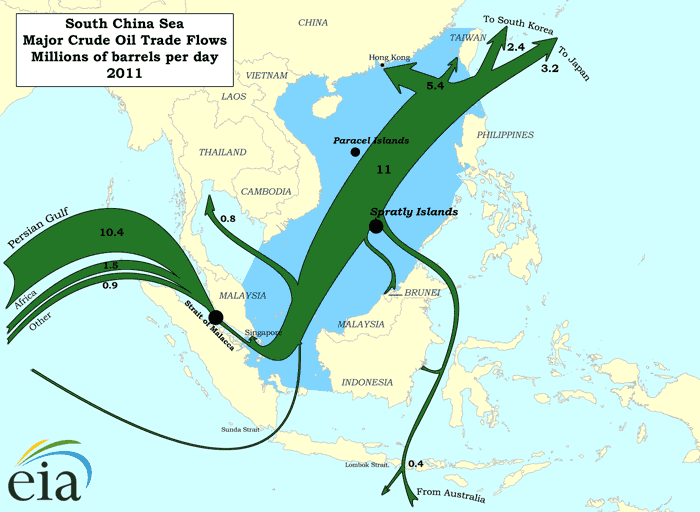
South China Sea has recently garnered increased media attention due to China reclaiming land and building an airfield on Fiery Cross Reef. The territorial dispute regarding Spratly Islands has been simmering since the 1970ies when oil was discovered in the region. South China Sea is also “one of the busiest shipping lanes in the world” with “more than half of the world’s supertanker traffic, by tonnage, pass[ing] through the region’s waters every year” (Wikipedia).

The Department of Energy has two interesting maps on their beta website showing LNG and crude oil transport for 2011.

Transport of liquefied natual gas (LNG) in trillions of cubic feet in the South China Sea:

Transport of petroleum in millions of barrels per day in the South China Sea in 2011:


(both maps from eia.gov website)

These are ‘Sankey-inspired maps’ rather than exact Sankey diagrams. Arrow widths are not maintained where the shipping routes pass through narrow straits. Nevertheless, transport volumes are generally on a correct scale.

Visualizing Passenger Boarding/Alighting

I was asked if Sankey diagrams could meaningfully be used to visualize passenger loads on a tram or bus line. Here is what I came up with:

These are fictitious values. I just labeled the stops A, B, C, … and decided to go for a short feeder line. At the last stop all passengers get off (e.g. to transfer to a train).

At each stop there are passengers that get on (green) and get off (red). The number of pax on the bus is shown by the blue arrows.

The profile would probably look differently at different times of day, so depending on the data availability one would have to create diagrams for off-peak/peak hours, weekdays/holidays and so on.

Your thoughts?

Hydrogen Bus Operation Sankey

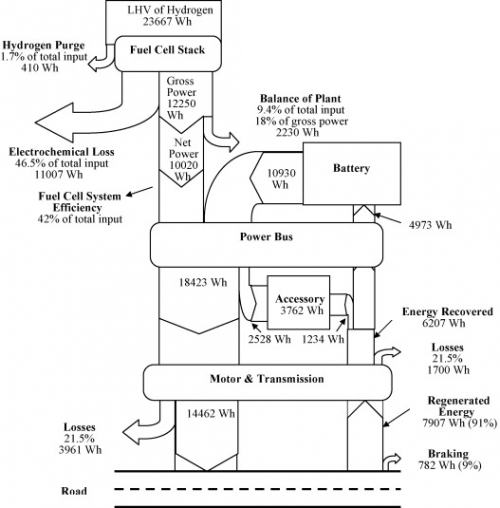
From a project summary on the webpage of the Fuel Cell Research Lab at University of Delaware’s Department of Mechanical Engineering comes this Sankey diagram.

This is for a bus operating on the University of Delaware campus. The Sankey diagram shows energy flow and losses in the hybrid power train for a typical drive cycle. Unit is Wh, percentages are given in the labels as additional information. Energy is recovered when braking and is fed back to the battery (see upstream arrow ‘Energy Recovery’).

“The fuel cell system balance of plant consumes a significant fraction of the energy of the hydrogen supplying the stack, so efficiency gains there are potentially quite useful. Most of the balance of plant energy feeds the air compressor, so efficiency could be increased by improving air humidification to allow lower air system backpressure”

Simple black and white diagram with a top-down orientation. The only extra that does not serve to carry information is the schematic road figuring at the bottom….

For the full publication check Bubna P., Brunner D., Gangloff Jr. J.J., Advani S.G., and Prasad A.K., “Analysis, operation, and maintenance of a fuel cell/battery series-hybrid bus for urban transit applications,” Journal of Power Sources, Vol. 195, pp. 3939-3949, June 15, 2010. doi:10.1016/j.jpowsour.2009.12.080