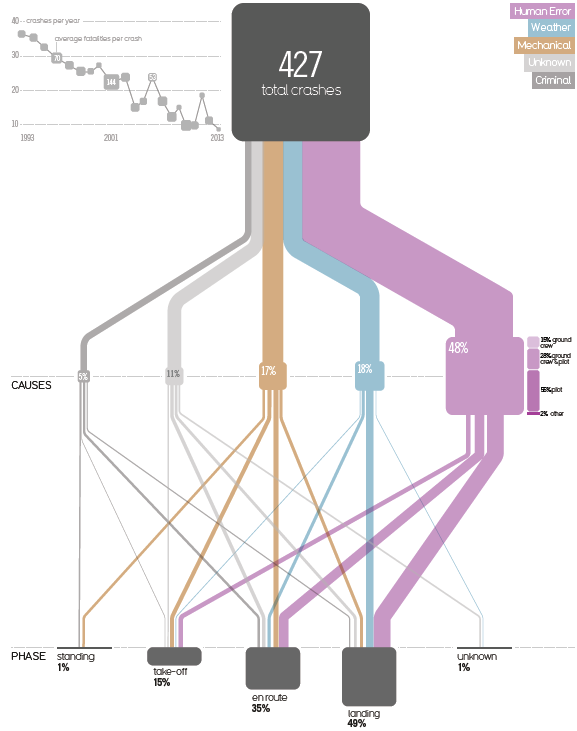
This one is from a very interesting 2015 blog post titled ‘Visualizing the causes of airline crashes’ by Rick Wicklin on the SAS blog.
The original graphic discussed is from David McCandless’ book ‘Knowledge is Beautiful’. Wicklin, a researcher in computational statistics at SAS has praise for the beauty of McCandless’ infographics, but criticizes the use of a Sankey diagram, points to two main issues with the diagram, and suggests to instead use a mosaic plot to convey the message.
The underlying data is for the time frame 1993 to 2013. The 427 aircraft crashes in that period are broken down in two categories: the cause of the crash (human, mechanical, weather, criminal) and the phase of flight when the crash occured (landing, en route, take off, standing on ground).
In addition to the width of the bands linking the nodes, the size of the nodes themselves are used to represent a percentage share. (This is BTW one of the problems that Wicklin identifies, read more here).
The inset at the top left should also be mentioned, as it shows that the absolute number of aircraft crashes over two decades has a downward trend… maybe a consolation to those that who are afraid of flying…
