Last August I reported about a Sankey diagram showing World GHG emissions, published on the website of the World Ressource Institute (WRI). I couldn’t show the diagram due to copyright concerns in that post, but to my delight, Tim Herzog, co-author of the WRI publication and Director of Online Communciations at WRI in a comment to my post granted permission. Thanks, Tim!
So here it is:
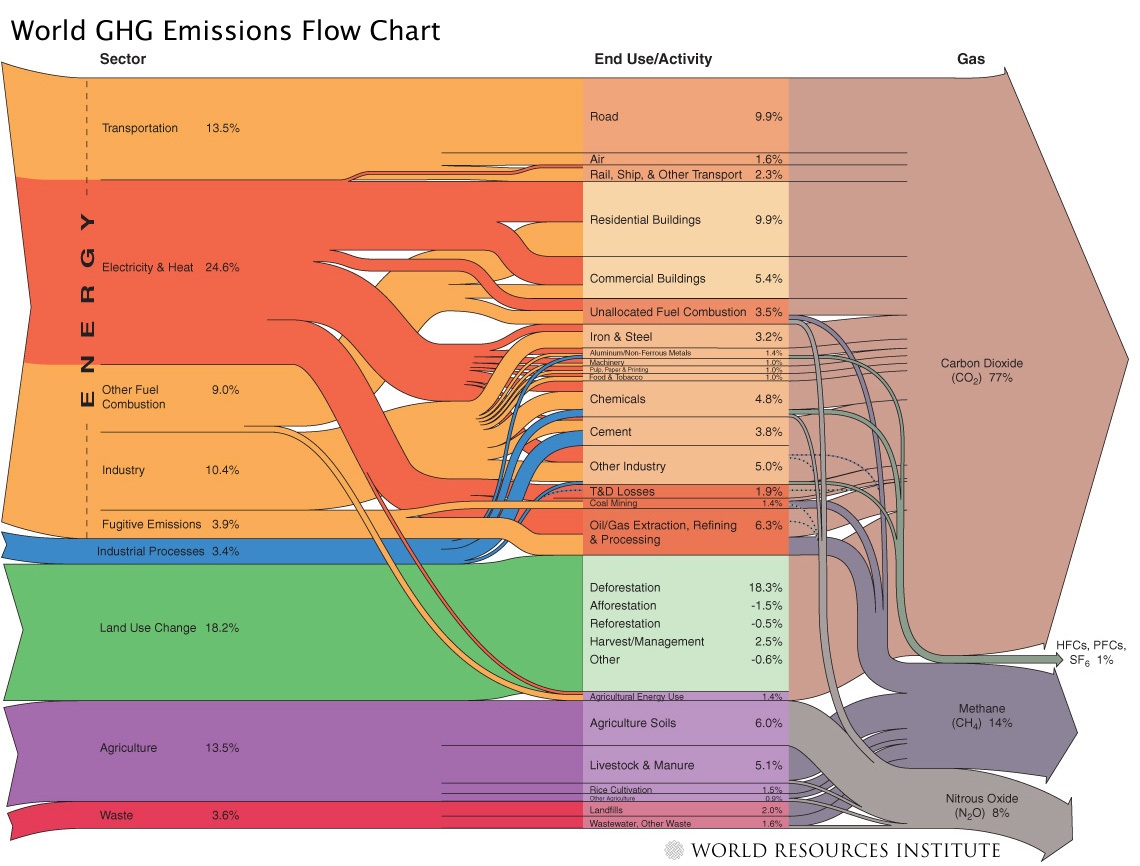
The diagram shows the activity sectors from which of greenhouse gases (GHGs) originate. The largest portion is from energy generation (including transport), followed by land use change and agriculture. Direct emissions from other industrial processes (other than combustion processes) and waste is comparatively small. The arrows on the right side give a breakdown into the individual gases with carbon dioxide as the main greenhouse gas (77%) followed by methane and N2O.
All data is for 2000 and given in CO2 equivalents with the GWP 100a weighting factors for methane, nitrous oxides, HFCs and PFCs from the IPCC 1996 report. The total quantity is an estimate of 41755 MtCO2 equivalent. Land use change shows negative numbers too, because credits can be given for reforestation (newly planted trees absorbing CO2).
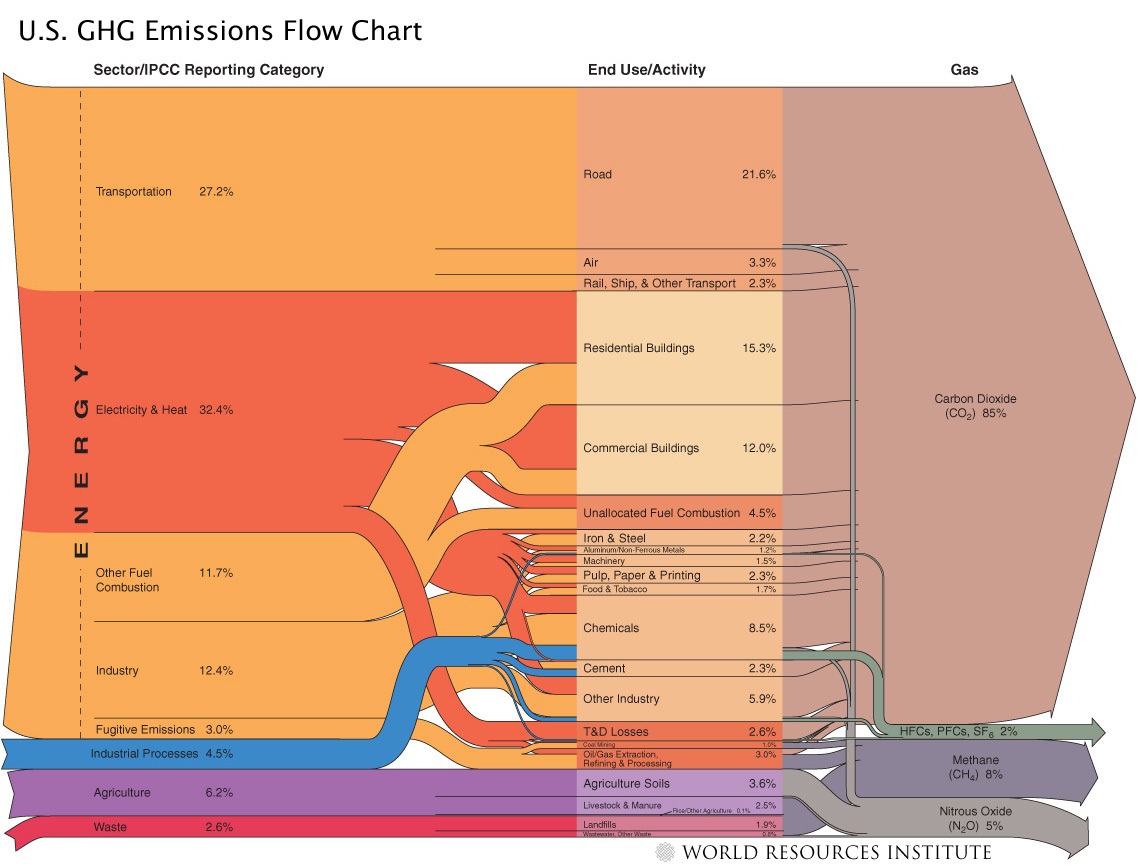
Here is the Sankey diagram from the same report just for the 2003 GHGs in the United States.
The overall CO2 equivalents are 6978 Mt in the US in that year, but the portion of GHGs from fuel combustion is higher. CO2 is 85% of the GHGs. For more details on the US GHG Sankey diagram, go to the WRI web page.
Kudos to the makers of these Sankey diagrams. Apart from the rich content they convey, they are also beautiful examples of how elegant Sankey diagrams can be.

