Month: January 2008

Chemical Reaction Sankey

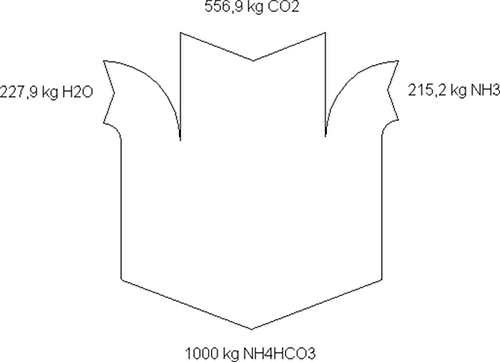
This rather simple Sankey diagram represents the idealized mass balance for making ammonium bicarbonate. The chemical reaction is H2O + NH3 + CO2 → NH4HCO3. It is taken from a Polish web page on chemical process technology.

The diagram is drawn with the freeware Sankey Helper. And it is nice to see that, while most of the Sankey diagrams are drawn with a left-to-right flow orientation, this one is top-to-bottom.

Material Flows in the U.S. Food System

If you enjoy browsing for tidbits of interesting information on the web, I highly recommend the collection of fact sheets on the website of the Center of Sustainable Systems (CSS) at the University of Michigan. This series of 2-page papers on topics, such as energy, water, waste, transportation or buildings, targets at the ordinary citizen and presents scientific information with bulleted list of interesting facts, nicely illustrated with diagrams, and sometimes recommendations for individual behaviour (“What You can Do”).

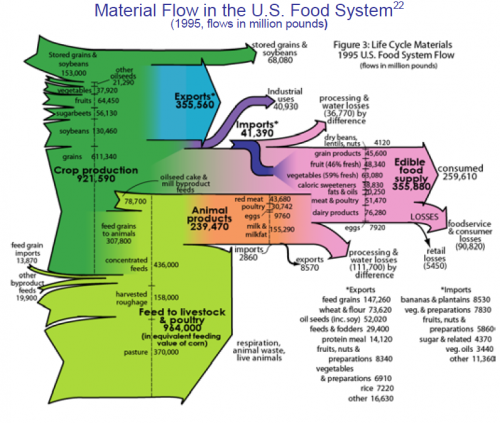
The fact sheet on the U.S. Food Chain shows the material flows for providing food in a Sankey diagram. Data is from 1995, the flow quantities are in million pounds.

The inputs from the left are limited to crops, feed and pasture. Other inputs such as water, fertilizers, etc. are omitted. The actual quantity of food consumed by U.S. citizens is shown on the pink arrow (355,880 million pounds). Exports of food are shown in blue and are about the same size (355,560 million pounds). A large portion of material into the food chain goes into “respiration, animal losses and live animals” (the latter probably being fed back into the food chain at a certain point, I assume, so consider them a foodstock. ,-)

There is much more to find in this Sankey diagram. So why not take a few minutes of your lunch break to explore it and read the full fact sheet. And while your at it, why not eat a locally grown apple while doing so …

Diagramas de Sankey? Si Se Puede!

The Mexican National Commission on Energy Saving (Comisión Nacional para el Ahorro de Energía (CONAE) present several success stories (casos exitosos) on their website.

One success story dates back to 1997, and describes how an energy efficiency study of fired heaters (i.e. boilers) was carried out in a Nafta producing facility in the Veracruz state of Mexico. As a result of the study, several suggestions for optimization were implemented. Fuel consumption could be reduced by 23-24 %, while the efficiency of the ovens could be raised by 13% (calentador BA-2001 B) and 16% respectively (calentador BA-2001 A).

Para los hispanoparlantes: el título oficial del proyecto fue “estudio técnico económico e ingeniería conceptual realizada a los calentadores a fuego directo BA-2001 A/B de la planta hidrodesulfuradora de naftas, del C.P.Q. “La Cangrejera”, ubicado en Coatzacoalcos, Veracruz” (otro candidato para el concurso mundial de titulos largos).

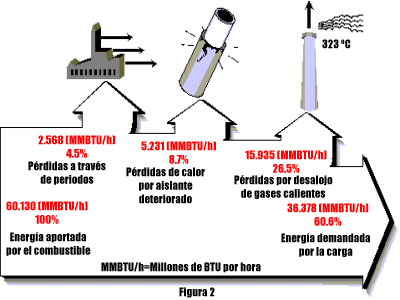
The heat losses are shown as Sankey diagrams. The first describes the optimal situation, with an energy efficiency of 82,4 % “as guaranteed” by the maker of the fired heater.

The two other Sankey diagrams show the energy balance of the heaters A and B before the implementation of the measures. They run with an efficiency of 60,6 % and 62,35 %, a “real world situation of one fired heater” /

The arrows branching off at the top show the heat losses. I like the fancy icons that show how energy is lost through the walls, because of deteriorated or insufficient insulation, and heat energy in the effluent gases. The flows are given in MMBTU/h (millions of BTU per hour).

Unfortunately two of the diagrams are not to scale: The arrow to the right in the second diagram should be roughly 2/3 of the width on the left side. It is about 4/5 (or 80 %) of the width, similar to the width in the first Sankey diagram. This is a visual exaggeration of the inefficiency. However, I refrained from featuring this in my informal “Lying with Sankey diagrams” series. 😉

Edit 05/2015: the web pages are not acessible any more. I had to restore the image from a local copy, and removed references to two other diagrams I had references to. -Phineas

Sankey Diagrams with Visio

Chris Roth, the Visio Guy in his latest article focuses on the question whether and how Sankey diagrams can be drawn in Microsoft Visio.

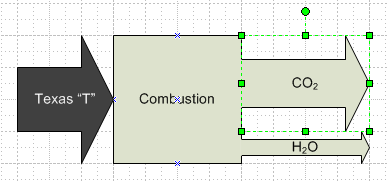
Can Visio do Sankey? While there are no Sankey Diagrams templates that ship with Visio, there are a few in-the-box shapes that can be used to create rudimentary Sankeys.

He identifies some problems with the Visio-supplied arrow shapes, and provides “a new version of the arrow shape which is more suitable to making Sankey diagram” for download. Really cool, Visio Guy!

In one of the follow-up comments Chris states that pre-built shapes can only cater for the most basic Sankey arrows, but “a proper, full-blown solution would utilize at least some code, if nothing else, for decent data-input dialogs, etc.”

Energy Balance for California

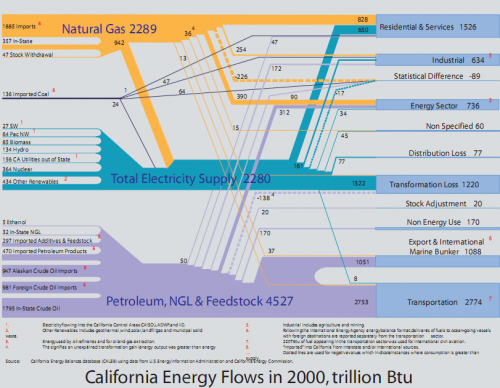
California Energy Commission in 2005 published the final report of a project called CALEB (California Energy Balance). The CALEB database is compiled by the Lawrence Berkeley National Laboratory (Berkeley Lab) and contains “data for energy production, transformation, and consumption for the State of California for the period 1990 to present.”

The report shows the California energy balance for the year 2000 as a Sankey diagram. (Source: Murtishaw S, Price L, de la Rue du Can S, Masanet E, Worrell E, and Sathaye J, 2005. Development of Energy Balances for the State of California. Sacramento, CA: California Energy Commission CEC-500-2005-068 (LBNL-54923))

A PDF with this diagram explains how to read it:

Reading from left to right, the figure shows all the inputs of primary (and imported secondary) energy into California’s economy in 2000. These are summed by major fuel types in the middle of the figure: petroleum and associated products, natural gas, and inputs to electricity generation. The right-hand side shows how all of the fuels are allocated to the various end uses.

The executive summary explains that the diagram shows some peculiarities for ‘Arnieland’ compared to other states. It also points out that further research is needed to collect more data and to be able to break down aggregated energy data.

This way of presenting the energy balance seems to develop as a kind of standard for representing energy flows for a state or country. Other examples can be seen here: Japan, Scotland, U.S., or Sweden.

The diagram has two special features which distinguish it from other Sankey diagrams:

Firstly, it shows negative flows as dotted Sankey arrows, indicating “instances where consumption is greater than supply” – something which on a physical level is of course impossible, but is explained with statistical differences and “unexplained transformation gain … in petroleum refineries” (NB: I would prefer to read “data inconsistency” here).

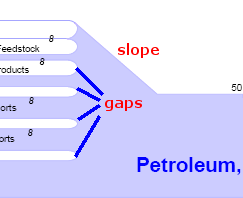
Secondly the breakdown of primary energy and imported secondary energy (input from the left) is fanned out leaving gaps between the arrow lines. The merged arrows are then “condensed” to be to scale again. This creates a 45° gradient at one side of an arrow section (or “slope” for those of you who are into winter sports). In these sections the arrow width can not be proportional to the quantities. A tribute to pay for better legibility of the diagram.