Month: August 2008

Water Balance (or: Metabolic Profile Sankey)

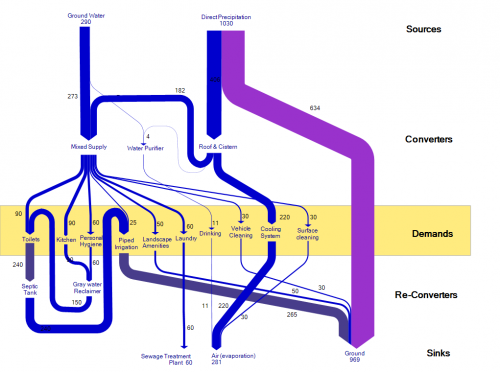
This article on “Conceptualizing the built environment as a social-ecological system” by Sebastian Moffatt (CONSENSUS Institute) and Niklaus Kohler (University of Karlsruhe) published in Building Research & Information, Volume 36, Issue 3 May 2008 , pages 248-268 has an exciting Sankey diagram in the section ‘Current perspectives, promising methods, missing pieces’ (scroll down about half way).

The authors explain Sankey diagrams as an instrument of Material Flow Analysis (MFA)

“Sankey (directional flow) diagrams are often used to summarize the MFA visually as an entire connected and balanced system. In a Sankey diagram the material flows begin with inputs from nature, then flow into intermediary processes (any infrastructure used for processing, converting, storing, or regulating), and then into the various end use(s). After use, flows may be reconverted by infrastructure systems for reuse or recycling. Ultimately, all flows are directed to a category of output (waste products emitted into air, into water bodies or into landfills; long-term storage; export). The balanced accounting thus tracks every flow from source to sink.”

The original Sankey diagram shown in this article is for an resource efficient house, planned or built in New Delhi (India). It sports the water flows through five groups of processes (sources, converters, demands, re-converters, and sinks). The authors call it a “five-partition metabolic profile”, and suggest that it can be done not only for a single house, but “for the built environment at any scale, from parcel to urban region”.

The unit for the quantities given is not indicated, but I presume the water flows are in litres.

When reproducing the Sankey diagram (see above) I tried to make it a little more clearer by changing the order of the (invisible) nodes, thus avoiding crossing flows.
World Greenhouse Gases as Sankey

A great Sankey diagram is available in the Charts&Maps section on the website of the World Resources Institute (WRI), “an environmental think tank that goes beyond research”.

It shows the sectors from which greenhouse gases (GHGs) are released (such as energy generation, land use change, agriculture) and the end use areas or activities, through which CO2, methane and others gases are relased.

Data is for 2000, the diagram was published in 2005. A very well done Sankey diagram indeed, and highly educational.

Unfortunately a request for showing this Sankey diagram here on the blog was not granted by WRI, and an attempt to purchase the publication right (OK, it was not an attempt, it was a price inquiry only) was in vain.

I have to respect WRI’s copyright policies, so you have to click here to view the World GHG Sankey diagram, or download the large version PDF.

They also did a Sankey diagram on U.S. Greenhouse Gas Emissions, available on their website and as a PDF. Enjoy!

Energy Use in Particleboard Production

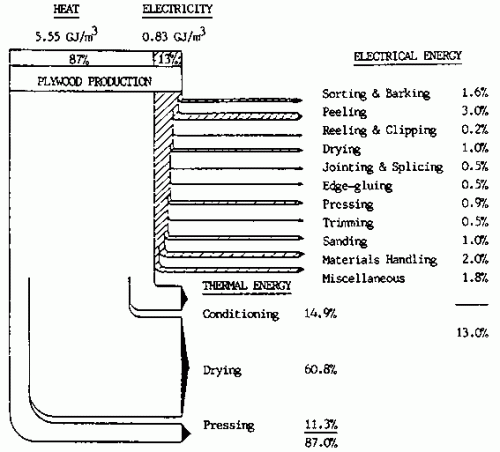
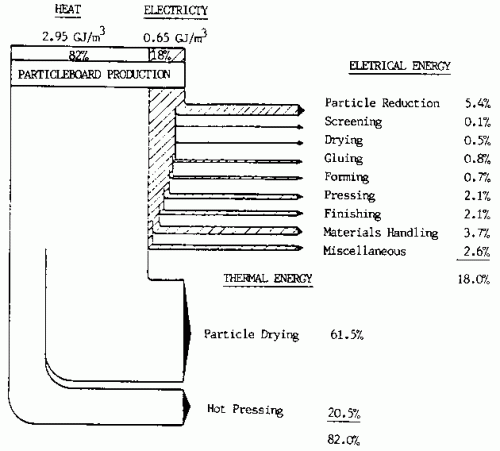
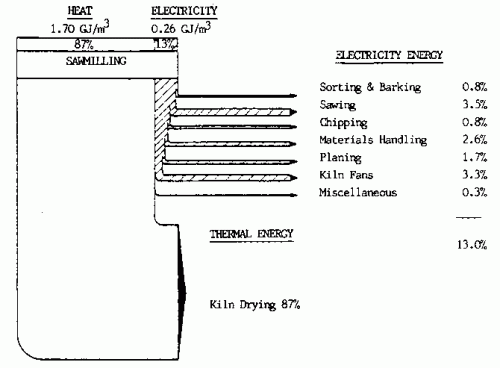
A reminiscence to the days when Sankey diagrams were drawn in black&white by hand and labeled with a typewriter. The three Sankey diagrams below from a 1990 article on “Energy conservation in the mechanical forest industries” by FAO (Food and Agriculture Organization of the United Nations, FAO Forestry Paper No. 93, Rome 1990) illustrates energy use in sawn timber, plywood and particleboard production.

Sawmilling:

Plywood:

Particleboard:

The article explains that

“Although the diagrams are of an approximate nature they do serve to identify the relationship that each major energy consuming centre has with each other and also readily identifies the prime energy users to which particular attention should be paid in any conservation effort.

In all three product manufacturing processes heating is by far the largest user of energy, representing some 82-87 percent of the total energy requirement in the manufacture of sawntimber, plywood and particleboard, with drying accounting for approximately 87 percent, 61 percent and 62 percent respectively.”

Use of Sankey diagrams with kind permission of FAO

The man behind Sankey diagrams @ LLNL

The Council on Competitiveness has just called on the presidential candidates to come up with a national energy plan, believing that future economic growth and security of the United States depends on energy efficiency across the U.S. economy, sustainable energy solutions, and development of new technologies.

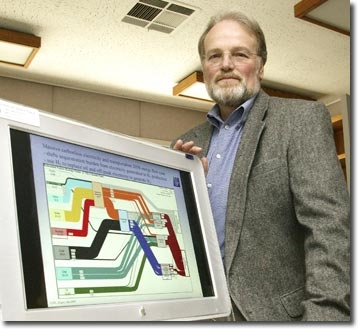
The new president might want to ask John Ziagos to advise him on energy issues. Ziagos is with the Energy & Environment Directorate at Lawrence Livermore National Laboratories, and an expert for energy scenarios. For me as a Sankey aficionado he is simply the “man behind the Sankey diagrams at LLNL”.

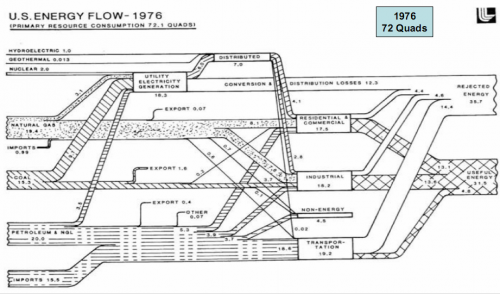
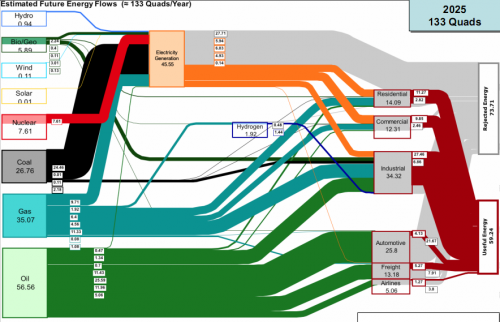
LLNL has been publishing energy flow diagrams for the U.S. over the last few years. In his public presentations (link1 – 2.9 MB, link2 – 4.8 MB) Ziagos impressively shows that even when implementing fuel cell technology for all vehicles, switching completely from coal and natural gas to renewable energy sources to generate the nation’s electricity, and building 270 new nuclear power plants … even then it would not be possible to stabilize U.S. carbon emissions between now and 2050. “If we want to move toward a carbonless future, no single technology will do – everything counts.” Ziagos says.

I am reproducing two energy flow diagrams for the U.S. from John’s presentations below. The first is for 1976…

… the second a 2025 projection:

While overall energy produced will rise from 72 Quads in 1976 to an estimated 133 Quads p.a. in 2025 [Note: 1 Quad(rillion) equal to 10E15 BTU, or 1.055 × 10E18 joules (1.055 exajoules or EJ) in SI units.], the ratio of useful energy to rejected energy gets worse.