Month: September 2008

“Sankeyware”

Just back from a short late summer holiday, enjoying a few “Sankey-free” days at the coast. To get going again I am presenting a Sankey diagram you might have seen already. It is Gabor Doka’s sample diagram for his ‘Sankey Helper’ application.

Sankey diagram created with Sankey Helper 2.1 (by G.Doka)

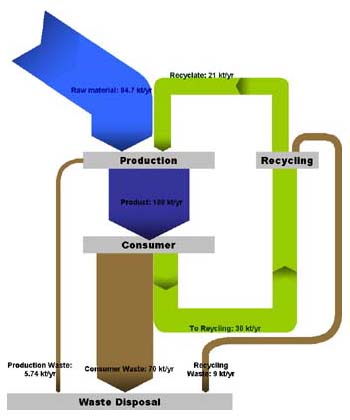
The tool comes as a Microsoft Excel workbook, with a number of macros and a toolbar that allows to create shapes and assignments from the data sheet to these shapes. Of course, graphical layout capacities of this helper tool is limited, however, simple diagrams can be drawn easily once you understand how to handle it.

Sankey Helper 2.1 is freeware – err, sorry! – “Sankeyware”. You must sent the author a Sankey diagram you created, but otherwise there is no cost. Nice idea! Download Sankey Helper from Gabor Doka’s website.

COD loads in Wastewater Treatment Plant

This Sankey diagram shows COD (chemical oxygen demand) in a waste water treatment plant that handles both municipal waste water as well as effluents from a chemical plant.

It was generated using the software package STOAT, which allows for dynamic simulation of wastewater treatment plants. Image with kind permission of Berlin-based EnviaTec GmbH.

The Sankey diagram does not show any flow quantities explicitly, and the values seem to be clustered into five or six fixed arrow magnitudes. The flows have a flat arrow base, and a rounded arrow head, which is uncommon, but still let’s you determine the flow direction. Process clipart icons overlay the nodes, where flows branch off or merge.

I have added the STOAT model to the list of software tools with Sankey drawing capabilities.

Sankey Diagram Use in Energy Auditing

A presentation titled ‘La eficiencia energética: una opción estratégica para la empresa y para el país’ (‘Energy Efficiency – a strategic option for companies and for the country’) by Pedro Maldonado of the Energy Research Program (Programa de Estudos e Investigación de Energía) at Universidad de Chile features a Sankey diagram as an important tool in energy auditing.

The diagram shows exemplary losses (pérdidas) in heat generation, heat transmission and the use of heat. Use of heat is broken down into drying, pasteurization, evaporation, etc. The main message of the author: “The energy we purchase is not what we ultimately use as energy for our productive processes”.