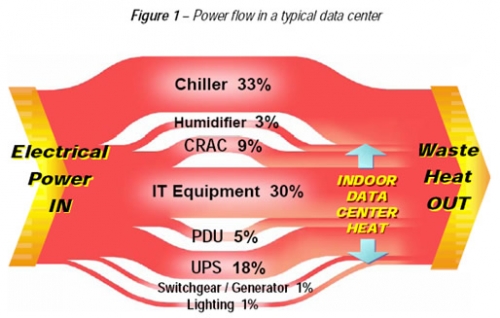
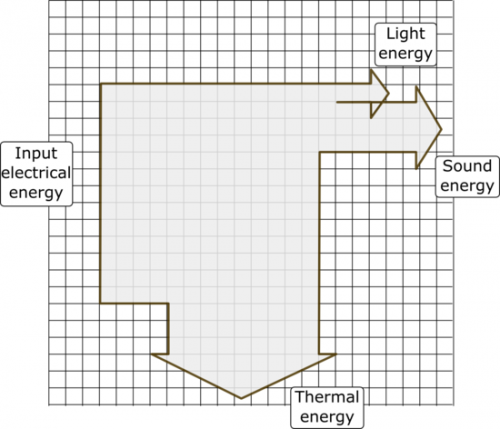
For most Sankey diagrams I find when browsing the web, a ‘left-to-right’ or ‘bottom-to-top’ orientation prevails. ‘Top-to-bottom’ is less common, but there are also examples like this one.
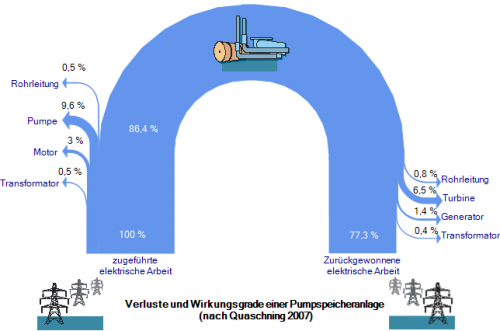
A rather untypical shape for a Sankey diagram has been up on the German page of the e!Sankey webpage.
It shows the energy balance for a pumped storage power plant as a curved shape, with the energy input at the left leg, and the energy that can be recovered (77.3%) at the right one.
Energy is stored “in the form of water, pumped from a lower elevation reservoir to a higher elevation. Low-cost off-peak electric power is used to run the pumps. During periods of high electrical demand, the stored water is released through turbines. Although the losses of the pumping process makes the plant a net consumer of energy overall, the system increases revenue by selling more electricity during periods of peak demand, when electricity prices are highest. Pumped storage is the largest-capacity form of grid energy storage now available.” (Wikipedia)
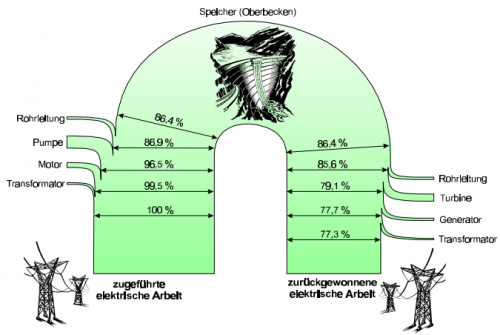
I searched for the original Sankey diagram in the source given (Quaschning 2007) and found this text with the diagram in chapter 6.1.2. That diagram already featured the curvy shape, and has just been reproduced similarly.
The use of the curve layout seems justified here. The author chose it to point out the difference in altitude. The upper basin is at the apex of the curve. Water pumped up from the lower basin requires energy, which can partly be recovered when the water runs down again.
What goes up…
