Month: June 2009

VisioGuy invents Radial Sankey Diagrams

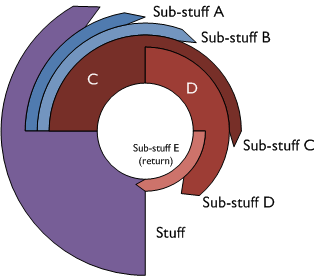
Chris the VisioGuy recently came up with Radial Sankey Diagrams. Although he didn’t seem to be sure if there is a “need for radially-oriented Sankey diagrams”, the commentators of his post immediately came up with ideas: use for rotating or radiating processes, cigarette rolling, recursive industrial processes, reinvestments, and so on… even stellar nuclear reactions were mentioned.

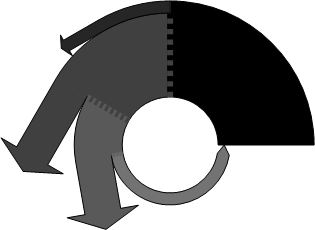
This is the ‘Everything Radial’ Circular Sankey Diagram

… and this is the ‘Tangential Fly-off’ Circular Sankey Diagram

One concern seems to be that the proportional arrow magnitude doesn’t work that well, since the human eye perceives the arrow area rather than thickness in such a circular Sankey diagram.

Thanks VisisoGuy for this contribution to the big basket of Sankey diagrams
Thermax shows benefit w/ Sankey diagram

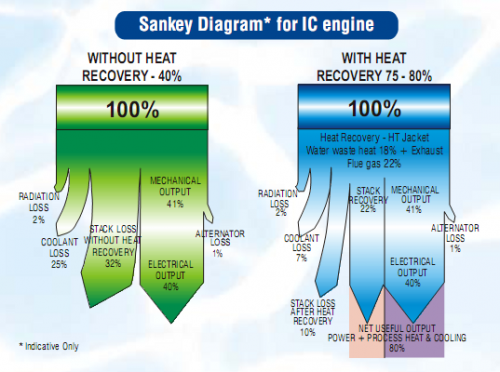
The PDF product brochure of Thermax Multi Energy Vapor Absorption Machines (Source: Thermax India Ltd, Pune) features a Sankey diagram comparing a conventional system (green) with a system that has heat recovery (blue).

The Sankey diagrams are labeled as “indicative only”. Fair enough, since the small flows (e.g. “radiator loss” and “alternator loss”) are not to scale. In fact this over-emphasis of the smaller flows seems to lead to an underrepresentation of the actual benefit of the Thermax system: The 80% “net useful output” of the blue diagram is only shown with a width of roughly 50% [measured with a conventional ruler off my screen…]

Any other product brochures with Sankey diagrams you are aware of? I actually found this pictured in a scientific paper (DOC).

It is also a rare example of a top-down orientation in a Sankey diagram. Most of the ones you find are left-to-right or bottom-to-top oriented.…

Diesel Engine Sankey Diagram

Just back from a few days at the beach, here is just a quick one…

User BoH created a Sankey diagram for a diesel engine and uplodad it to the WikiCommons. It is in Dutch and shows the energy efficiency of the fuel being burnt in the motor.
Sankey diagram for Diesel engine (WikiCommons)
49.3% of the energy is useful energy transformed into motion, while the rest is lost. The main losses (30.45%) occur at the exhaust gases, and with cooling water (approx 10.5%).

The smaller arrows are not to scale (see the 0.76% arrow branching off on the left side compared to the one representing 1.5% (smeeroliekoeling, cooling of lubricant oil)). Also, I am not sure whether the author forgot an arrow at the blue node labeled “Lucht” (air).

Anyway, apart from these flaws it is a neat diagram. I particularly like the color gradient from ‘red hot’ to ‘cool green’.