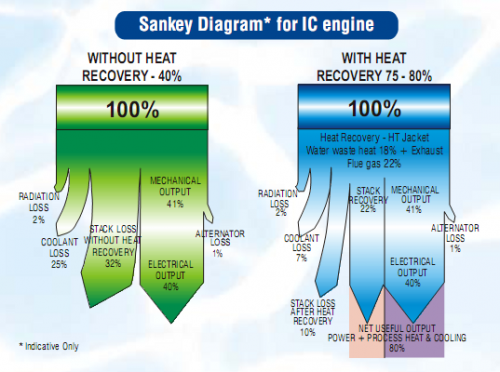
The PDF product brochure of Thermax Multi Energy Vapor Absorption Machines (Source: Thermax India Ltd, Pune) features a Sankey diagram comparing a conventional system (green) with a system that has heat recovery (blue).
The Sankey diagrams are labeled as “indicative only”. Fair enough, since the small flows (e.g. “radiator loss” and “alternator loss”) are not to scale. In fact this over-emphasis of the smaller flows seems to lead to an underrepresentation of the actual benefit of the Thermax system: The 80% “net useful output” of the blue diagram is only shown with a width of roughly 50% [measured with a conventional ruler off my screen…]
Any other product brochures with Sankey diagrams you are aware of? I actually found this pictured in a scientific paper (DOC).
It is also a rare example of a top-down orientation in a Sankey diagram. Most of the ones you find are left-to-right or bottom-to-top oriented.
