Month: October 2011

New blog on MFA diagrams

A new blog dedicated to Material Flow Analysis (MFA) diagrams is available over at blogspot.

Material Flow Analysis (also refered to as Material Flow Accounting) is a research topic that focuses on specific substances or material flows on a macro level. Typically the system boundaries are a region or a country. Urban metabolism studies also use MFA diagrams. A key feature is the representation of stocks (storage or accumulation of material) within the system.

I have previously presented MFA diagram samples here on the blog that have Sankey diagram characteristics (i.e. arrow magnitudes proportional to flow quantities, directional arrows).

Here are two examples of MFA diagrams from the new blog for you to enjoy:


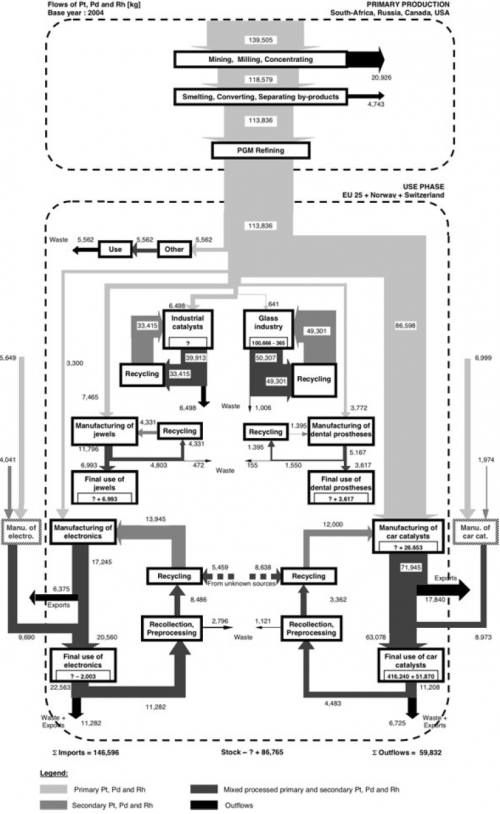
Platinum Flows in Europe. Source: Saurat, M., Bringezu, S., 2008. Platinum Group Metal Flows of Europe, Part 1 (via MFA diagram blog)


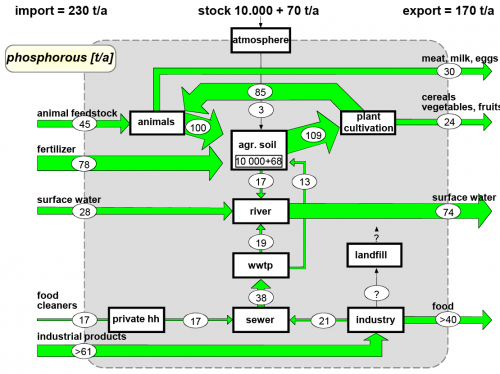
Phosphorus Flows. Source: Paul H. Brunner, 2007. MFA of regional lead flows and stocks [t/y] (via MFA diagram blog)

Make sure you visit the MFA diagram blog from time to time (I have put the link in the blogroll on the right), to see new interesting diagrams. I will also try to present some of them here…
Find the error…

Just back from a short break. A few nice Sankey diagrams and links to interesting diagrams in my inbox. To get into regular blogging mode again, here is one from my bookmark folder. Enjoy. More to come soon…

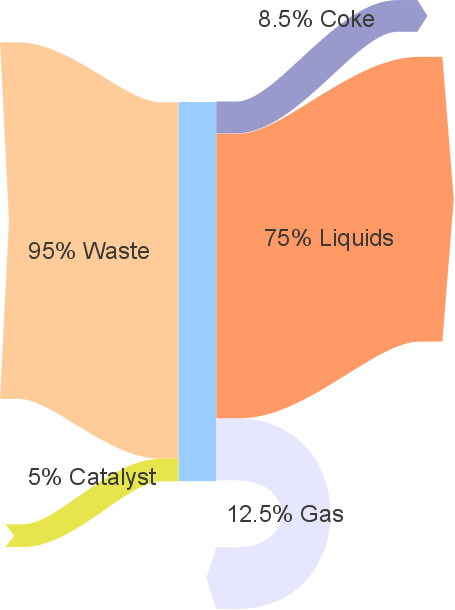
A simple percentage breakdown of mass inputs and outputs. Even though it only has 5 arrows (2 in, 3 out) there is an error in this Sankey diagram. Who can spot it? First commenter to tell the answer will get a honorable mention.

VisualizeGreen.com Free Sankey Template

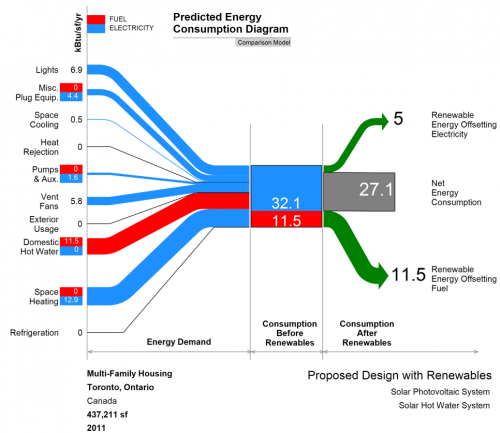
Premnath Sundharam from the Visualize Green blog contacted me to draw attention to a Sankey diagram template he has made and that is available for download on his site.

The diagram is for predicted energy intensity for buildings. An Excel template is provided that allows entering the data. You can use this with the free trial version of e!Sankey (registering required). All elements of the diagram and the entry sheet is explained in detail by Premnath. In regard to the unit (KBtu per square foot per year) he says:

Last but not least, kBtu/sf/yr is becoming the universal (US) unit of communicating building energy consumption. This unit is called the EUI – Energy Use Intensity and since it is a simulation of how your building will perform, it is called PEUI – Predicted Energy Use Intenisty.

Good stuff, Premnath! Thanks for making this available to everyone.

Note November 2011: Also look at Premnath’s Energy Story here.