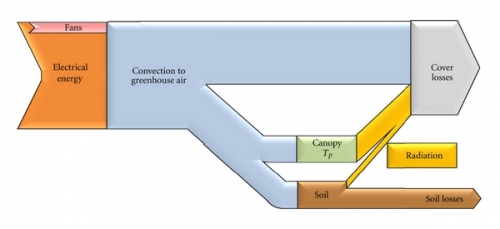
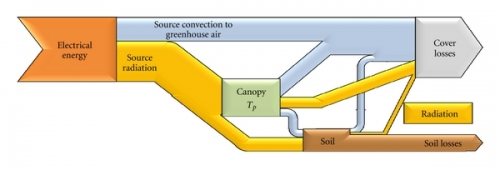
The below two Sankey diagrams can be found in the following open access article: A. Kavga, G. Alexopoulos, V. Bontozoglou, S. Pantelakis, and Th. Panidis, “Experimental Investigation of the Energy Needs for a Conventionally and an Infrared-Heated Greenhouse,” Advances in Mechanical Engineering, vol. 2012, Article ID 789515, 16 pages, 2012. doi:10.1155/2012/789515
Conventional forced air heating of a greenhouse
Infrared (IR) heating of a greenhouse
The arrows have a fancy 3D effect. No quanitative reference is given, but the article mentions that “the diagrams are qualitatively representative of the energy flow of systems utilizing burners”.


