Month: June 2012

Water Footprint Sankey Diagram

Water footprinting has been a hot topic in the last two or three years. Water use for the production of a product, ot the water consumption of an individual, a business, or a nation are referred to as water footprint. A mere volumetric water fooprint is the simplest version, but more elaborate methods for assessing the impact on the water system have also been developed (e.g. Hoekstra, Pfister, Milà i Canals). The water footprint is also finding its way into Life Cycle Assessment with some impact assessment methods being expanded to cover the water issue.

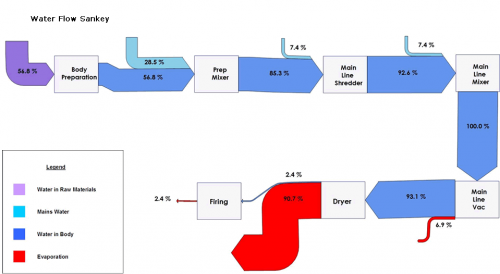
The below is a simple Sankey diagram of embodied water. It has been published on the website of consultancy firm Ceram. Ceram conducted a water use study at the Wienerberger brick production site with a gate-to-gate perspective. So this is far from being a full water footprint, as it covers only the processes on-site, but nevertheless it is one of the first examples of a Sankey diagram being applied in that domain. [Anyone knows of other water footprint Sankey diagram examples, please let me know.]

There are no absolute values, but only percentage shares of water intake, water embodied in the product and evaporation. Only a small fraction of the water contained in the (wet) brick mass remains in the final bric (2.4%) with the larges fraction evaporating in the drying process.
Denmark 2050 Nuclear Free Energy Scenario

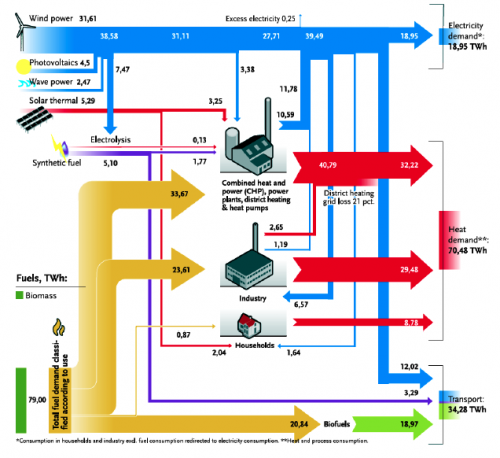
Found the below Sankey diagram in an article titled ‘La politique énergétique du Danemark. Vers un scénario 100% renouvelable en 2050’ by Thierry de Larochelambert of Institut FEMTO-ST via sortirdunucleaire.org.

The article says: “Le diagramme de Sankey (synoptique) ci-dessous illustre les flux d’énergie produites, converties et consommées par secteurs dans la structure énergétique proposée par le Plan Climat IDA à l’horizon 2050. [Translation: The synoptic Sankey diagram below illustrates the energy flows that are produced, converted, and consumed by the different sectors, as proposed in the IDA Climate Plan with a time horizon 2050]”

Units are in terawatt hours (TWh) and relate to one year. The primary energy supply is 112.86 TWh. Some tiny flaws in the Sankey diagram, such as overlapping flows, arrow heads that overemphasize large arrows, and an issue with rectangular bends. But overall a very good Sankey diagram that gets the message across. Definitely worth a fav point…

The 2050 scenario by IDA foresees a nuclear free, 100% renewable energy production with biomass and wind power being the main energy souces. As the article explains, the transition from 50% to 100% independence between 2030 and 2050 is an extraordinary technical, scientific and economic challenge (“un défi technique, scientifique et économique extraordinaire”, p. 6) that will require some measures to be implemented, such as a 10% drop in electric energy demand, and a shiftover of 50% of Danish freight transports being moved to rail.

Exciting article. For those of you who read French: here it is. The original ‘IDA Climate Plan 2050 by the Danish Society of Engineers (IDA) where this Sankey diagram was first published is here (in English).