Water footprinting has been a hot topic in the last two or three years. Water use for the production of a product, ot the water consumption of an individual, a business, or a nation are referred to as water footprint. A mere volumetric water fooprint is the simplest version, but more elaborate methods for assessing the impact on the water system have also been developed (e.g. Hoekstra, Pfister, Milà i Canals). The water footprint is also finding its way into Life Cycle Assessment with some impact assessment methods being expanded to cover the water issue.
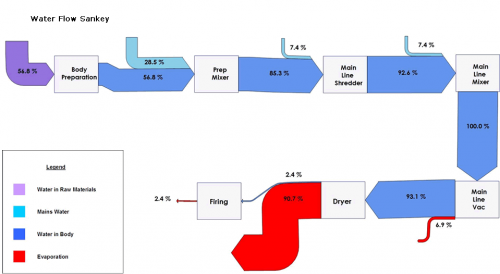
The below is a simple Sankey diagram of embodied water. It has been published on the website of consultancy firm Ceram. Ceram conducted a water use study at the Wienerberger brick production site with a gate-to-gate perspective. So this is far from being a full water footprint, as it covers only the processes on-site, but nevertheless it is one of the first examples of a Sankey diagram being applied in that domain. [Anyone knows of other water footprint Sankey diagram examples, please let me know.]
There are no absolute values, but only percentage shares of water intake, water embodied in the product and evaporation. Only a small fraction of the water contained in the (wet) brick mass remains in the final bric (2.4%) with the larges fraction evaporating in the drying process.

1 Comment
Another one for tiles can be found here: http://www.ceram.com/newsroom/case-studies/johnson-tiles-water-footprint/
Comments are closed.