Month: October 2013

New Zealand GHG Emissions Sankey

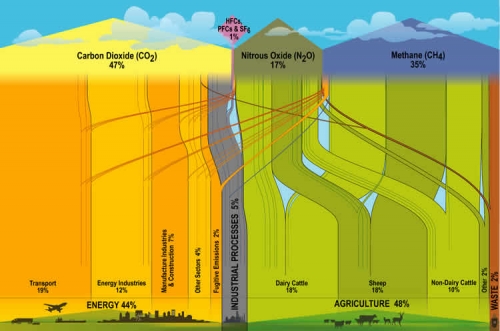
New Zealand’s Ministry for the Environment has the below Sankey Diagram on Greenhouse Gases (GHG) Emissions on their website.

It is interesting to compare this to the U.S. or to the world average. Similar GHG emissions diagrams have been published by the World Resources Institute WRI.

In NZ the main sources of emissions contributing to climate change are from agriculture (48%), while in the U.S. only 6.5% and on a world average this is only 13.2%. (Note: WRI data is for 2003, and there might be methodological differences in the background statistical data. But the proportions should be more or less correct).

Energy consumption accounts for more than 86% of the GHG Emissions in the U.S., and 44% in NZ. Quite a different panorama, and different challenges in New Zealand.
Yet Another ‘Flujo de Energia’ Diagram

The INCyTDE blog article that featured the Energy Balance for Guatemala presented in a post last week also contains two other energy flow diagrams from other Central American countries.

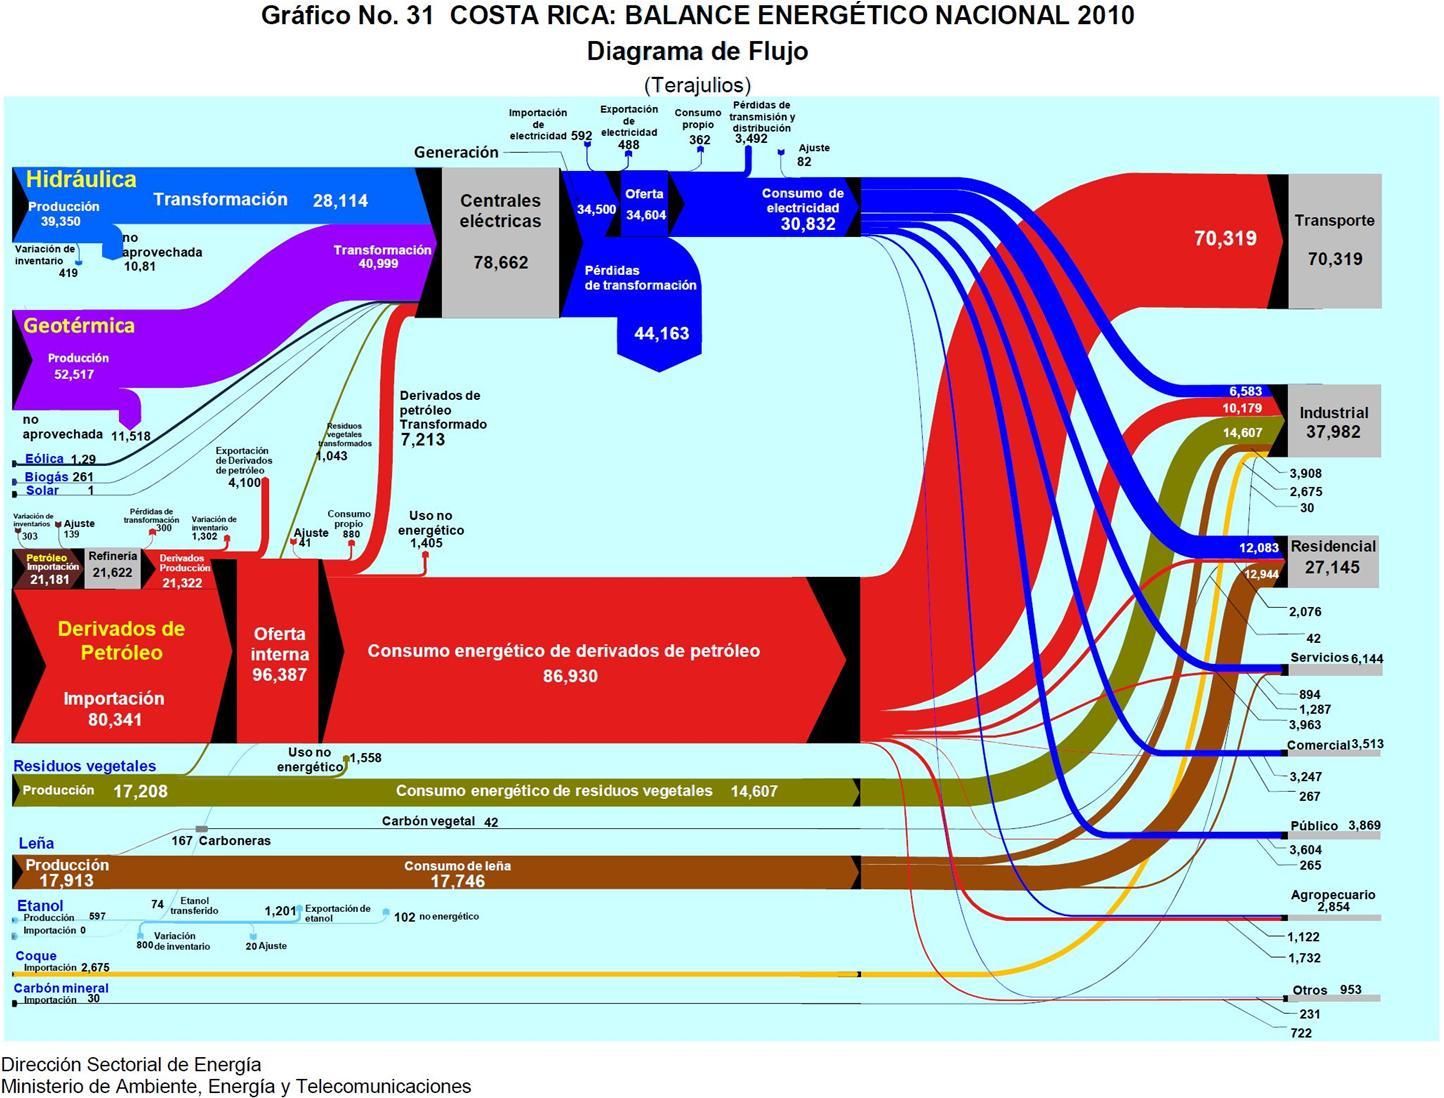
Here is the energy flow Sankey diagram (Balance Energetico Nacional) for Costa Rica for the year 2010.

In contrast to the situation in Guatemala, the dominating fuel is petroleum. The other two important feeds are from hydro and geothermal. Wood is used as heat source in private homes (17,746 TJ), and, with about the same amount, biowaste (residuos vegetales) constitutes an energy source for industry (17,607 TJ).

Flows are in TJ. The diagram is provided by the Ministry for Environment, Energy and Telecommunications.

And this time the diagram is impeccable…

Energy Efficient Technologies, Cogeneration

The following Sankey diagrams are from a report published in 2005 by Austrian Environment Protectionn Agency (UBA). The report is on energy efficient technologies and measures to increase efficiency and features practical examples from industry.

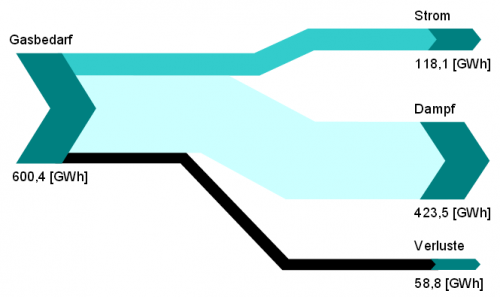
Both Sankey diagrams are from the section on cogeneration (chapter 5, p. 105 and p. 106). The first one shows how natural gas is being used to create 118 GWh electricity and 423.5 GWh steam with an efficiency of 90%.

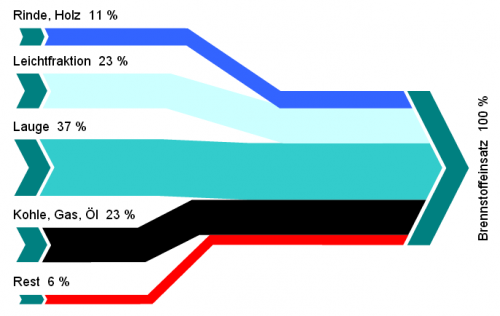
The second diagram is the breakdown of fuels used in another industrial cogeneration plant. It only features percentage values.

Both sets of data could also be displayed in pie charts, but the Sankey diagrams with directed arrows make an allusion to the output from gas, and to the input feed (in the second diagram).

Energy Balance for Guatemala

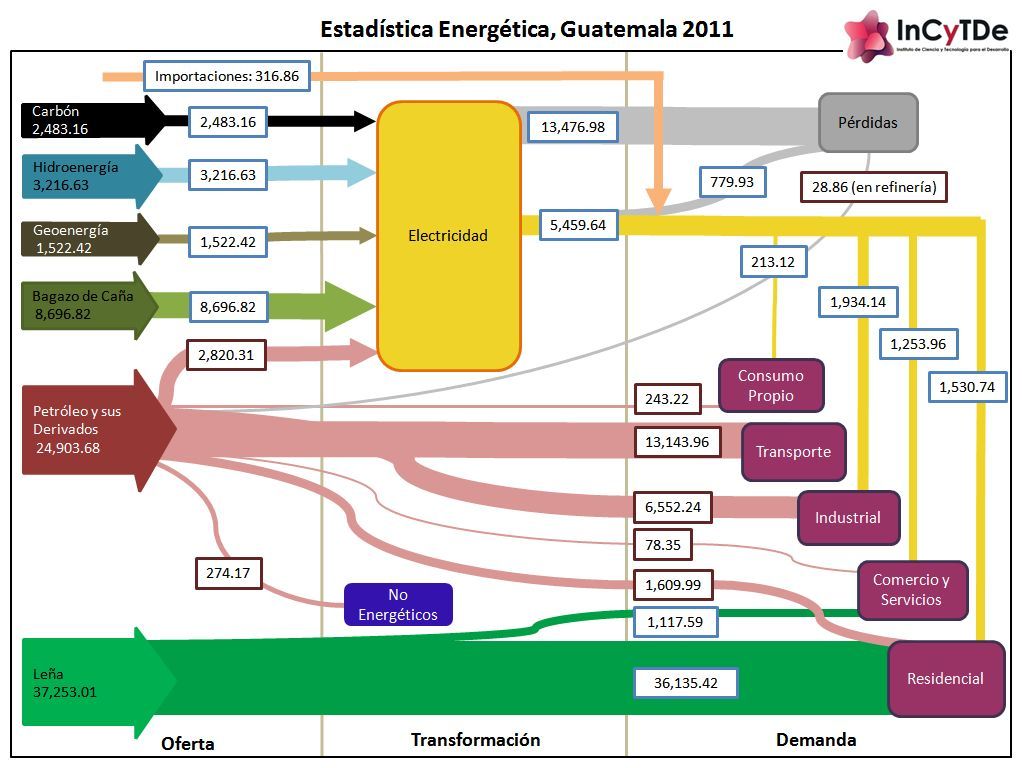
The research institute with the hard-to-pronounce acronymic name INCyTDE (Instituto de Ciencia y Tecnología para el Desarrollo at Universidad Rafael Landívar in Guatemala) has published a Sankey diagram with the energy flows for their country for the year 2011.

In regard to design the diagram has many issues: Apparently it was created using a drawing tool that supports primarily horizontal and vertical arrows and Bezier curves. But the diagram loses a lot with branching and joining of arrows almost non-existent.

Flows are more or less to scale. The unit is not shown in the diagram itself, but explained in the text (kilo barriles equivalentes de petróleo, KBEP = kilo tonnes of oil equivalent, ktoe). Data is from national statistics published by the Energy and Mining Ministry.

The content of the energy balance diagram is quite interesting, especially if you compare it to similar diagrams of other countries or the world average.
Wood is the most important energy in Costa Rica (green arrow ‘Leña’, 37.251 ktoe in 2011). Bagasse from sugar cane (dark green arrow ‘bagazo de caña’, 8.696 ktoe in 2011) is used for almost half of the electricity generation. Petroleum and derivates (dark pink arrow, 24.903 ktoe in 2011) however do play an important role for vehicles (transportation).

Waste Sorting Sankey

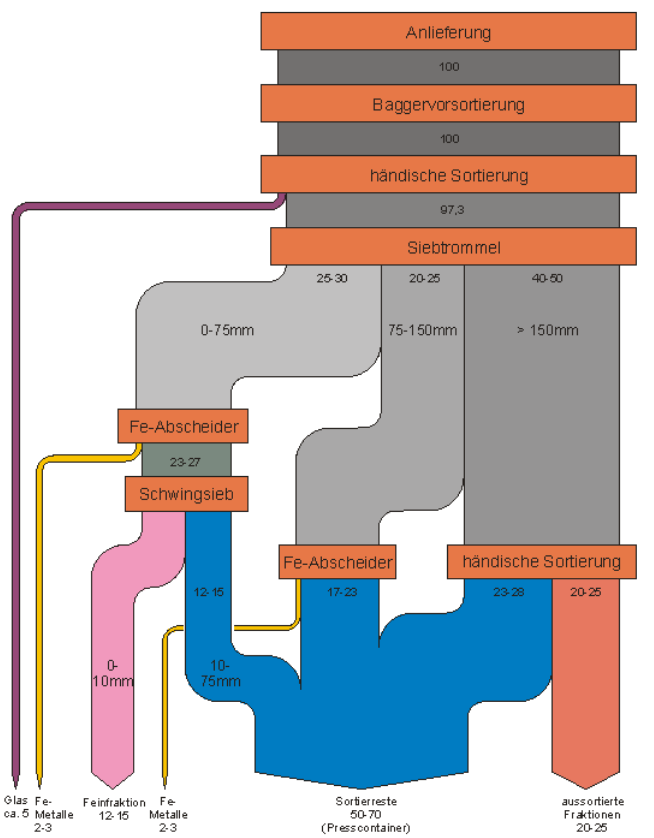
From this presentation by Berlin-based consulting firm UEC comes the below Sankey diagrams on sorting of waste in a waste treatment facility in 2003.

No absolute values are given, only a percentage breakdown of the waste that is being treated.

After the first steps, the drum sieve (‘Siebtrommel’) splits the waste flow in three main fractions based on the size of the shreddered waste. The blue arrow are unsorted remains, the colored ones are recovered materials.

Only apparent flaw of this Sankey diagram is that the arrow labels show ranges for values. An accompanying table in the presentation has the minimum and maximum sorting quotas. Not clear which value was used for determining the arrow widths.