Month: November 2014

Landscape of Climate Finance

The ‘Landscape of Climate Finance’ is a project by the Climate Policy Initiative. CPI “works to improve the most important energy and land use policies around the world, with a particular focus on finance. (This) helps nations grow while addressing increasingly scarce resources and climate risk.”

At http://www.climatefinancelandscape.org/ the have put up graphically appealing and beautifully crafted slideshow with facts on climate finance. How much is spent? Where does the money go to? Who are the receiving countries. Please browse the slideshow here.

Below are two Sankey diagrams from the 2013 report on climate finance.

The first is a rather coarse overview showing the international funding of climate projects by OECD countries and Non-OECD countries. On the right side the recipients breakdown: within their own borders, OECD countries, Non-OECD countries. Details on the countries are available in the report. Flows are in billion US$.

The other Sankey diagram is more complex. Here we can see the sources of climate finance and intermediate agents, the instruments, the recipients and the uses (adaptation and mitigation).

The incoming flows from the left are mostly “not estimated” (NE) and therefore are not to scale with the outgoing arrows. There are many annotations on assumptions and constraints, so please don’t make conclusions directly from the image. In the online version one can hover over the nodes to receive more information.

Congratulations to CPI for this work. They are tackling a complex issue graphically, and make good use of Sankey diagrams for visualization.
Another one for Car Engine Effciency

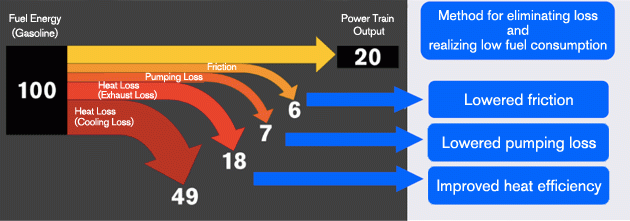
Followup to my post a few days ago on energy efficiency in an engine: Someone mentioned the below diagram that can be found on the Nissan Technology website.

Much simpler, actually a straight-forward breakout Sankey diagram. No sequencing of engine elements where power is lost as in the diagram from the Australia Gov report.
Strong emphasis on arrow heads … but worst of all flows are not to scale! 49 out of 100 should be roughly half the height of the ‘Fuel Energy’ node, but it is only 40%. Fail!

Visualizing Compiler File Sizes

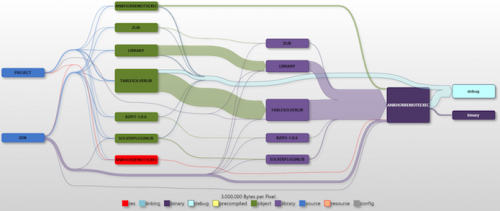
Interesting blog post and use case for Sankey diagrams by Dr. Ulrich Sigmund at the ANKHOR Feel Your Data Flow blog. He visualizes compiler file sizes using Sankey diagrams.

I am not an expert at this. But apparently 1 pixel in a Sankey arrow represents 400.00 Bytes being handled by a compiler.

In the above simple pic the main chunk of data is code from the SDK directly.

In the next diagram there are intermediate steps. There are objects from the SDK, but also a fair amount created from project files. They are used to create libraries and finally to compile the product. The bright blue arrow is debug info collected during the build process.

Ulrich concludes: “The Sankey diagrams do not only show why your hard drive is cluttered with intermediate files, they also helped me spot some fragilities in the build process. Sometimes the build order was not 100% correct and some of the intermediate files ended up in the wrong folders (due to the fact that the projects have been moved through five generations of Visual Studio by now).”

Any IT guys following here to comment whether this is helpful?

Energy Loss in Vehicle Engine

Was browsing through my bookmarks and saved images and found the below diagram. Blame it on my mood today, but this one calls for bashing.

Published in a 2010 report by Australian Government, Department of Resources, Energy and Tourism. ‘Energy Efficiency Opportunities. Energy–Mass Balance: Transport’ figure 11 on page 26 this so-called Sankey diagram looks like a aerial view of my nephews playing room with his building blocks spread on the floor… While I generally appreciate a Sankey diagram being used in a government report on energy consumption or loss in transport, I think this one is poorly executed.

If you look at the numbers you will even see that they don’t add up correctly at the ‘Motive Power’ node.

The diagram shows how energy from fuel is lost in different stages of a vehicle motor (engine, power train, transmission) with approximately 21% of the energy being used as power at the wheels. This value is just an example, and not for one specific vehicle. But 20% efficiency seems to be more or less the average in a passenger car.

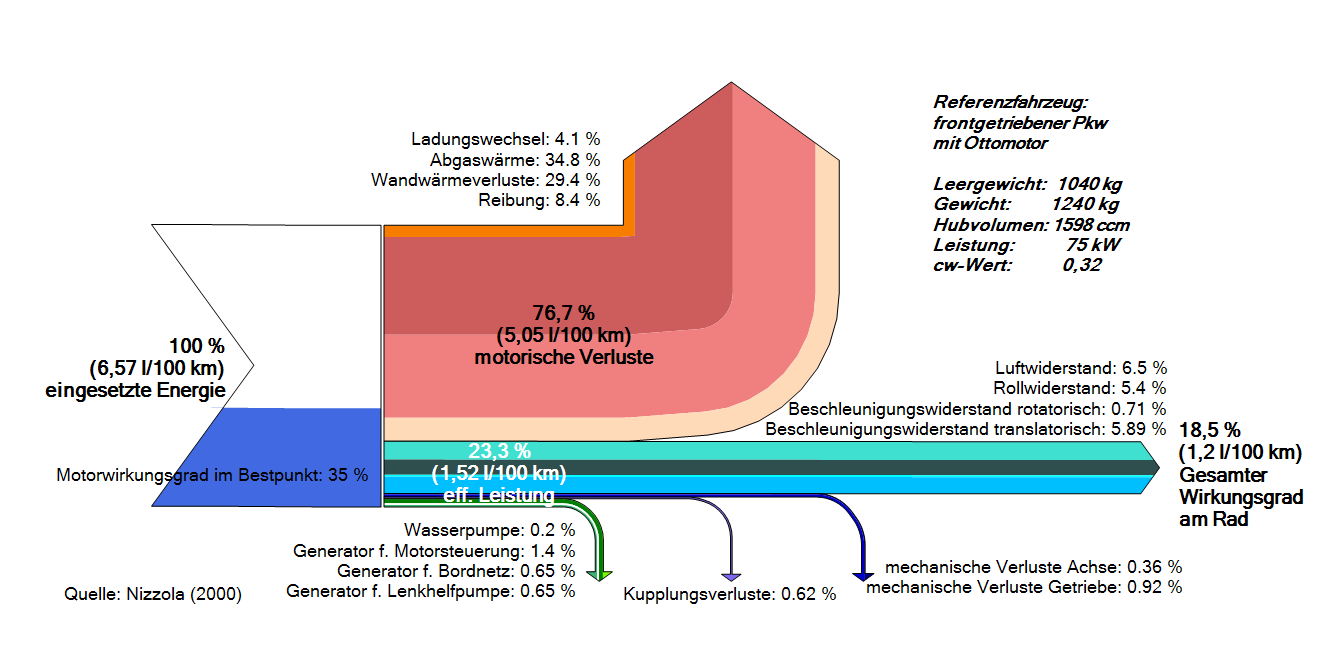
I remembered I had seen another Sankey diagram on the e!Sankey forum with the same topic.

This one is in German but you may be able to understand the main items. The red arrow are losses at the motor. The stacked turquoise-blue arrow to the right (18.5%) is energy-at-wheel. All in all there are many more details, but still the diagram remains rather “compact”.

I am sure there are more Sankey diagrams on energy losses in vehicles out there. Let me know if you find other examples to compare.