Month: July 2015

Digesting Food: Mass Balance Sankey

I am sure some of you know this situation: Stepping on the scales in the morning, still half asleep, just to find out you have gained a kilogram or so… but did I really eat that much yesterday?

Well, Ivan Muñoz from the Centre for Environmental Strategy (CES) at the University of Surrey approached this question from a more scientific perspective to create ‘A simple model to include human excretion and waste water treatment in Life Cycle Assessment of food products’. In LCA you are trying to explain all processes along the product life cycle in detail and, if possible, with a closed mass balance. When you look at the ‘use phase’ of a food product life cycle, where the food is being consumed it doesn’t disappear, it is just transformed in the human body.

The researcher and his group have determined a mass balance of 1 kg of boiled broccoli. It is visualized with two different Sankey diagrams.

One is a mass balance including water. The “first diagram reveals that human digestion is mainly concerned with water, from a mass point of view” (p. 13)

No units or absolute values are given, but one can see that wet matter (water) is the main constituent of the food ingested. It leaves the body as water through the lungs (exhalation), as urine and with faecal solids (light blue arrows). In fact, the human body could be considered a huge water extraction facility…

The other Sankey diagram just focuses on dry matter and oxygen, explicitly excluding the water in the broccoli from the mass balance.

Here we can observe that some 40% or so of the food dry matter are actually solids from non-biodegradable organics (fibres). See the arrow with the appropriate color 😉 . The remainder leaves the body as faecal liquids. In this Sankey diagram the human body rather is an emission source of greenhouse gases (GHG), solid waste and liquid waste.

Apparently in both diagrams no mass is maintained within the system…

The researchers also did an “endosomatic energy balance” and found that some 63,4% of the broccoli is “energy actually used in metabolism” while 36,6% of the energy is “energy in excretion products (lost energy)” (p. 15)

Now you might say ‘Who gives a … dime?”, but I found this to be a really fascinating topic. It is probably also the first Sankey diagram ever to be used to visualize human digestion.
FIFA accounts – my version

In this post I had criticized a Sankey diagram depicting FIFA accounts published at BBC News. By drawing operating profits disproportionally they would overemphasize certain arrows.

Here is my version of the diagram, based on the values given in the article by Paul Sargeant (no warranty for the accuracy of these numbers). The orange arrow represents the operating profits, this time at the same scale.

Compare for yourself what impression the two diagrams create in you… and let me know by leaving a comment.

Misc Sankey Diagrams Uncommented 10

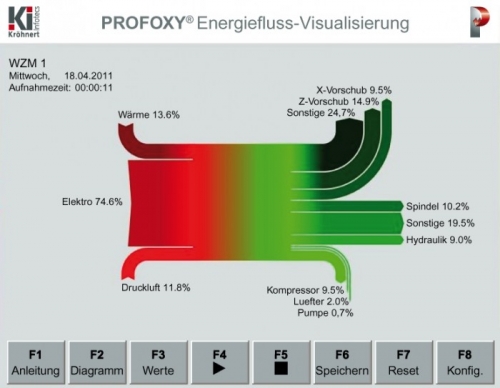
Energy flows are visualized on a machine touch screen panel, giving realtime information of energy consumption. This is from the PROFOXY system offered by Kröhnert Infotecs, a German engineering firm.

Basically two pie charts, one for the red part on the left side, and one for the green part on the right, would suffice (… I can’t believe I’m actually advocating pie charts here 🙁 ), but this Sankey diagram additionally gives a notion of “flow” and allows a grouping of consumers (on the right).

Paper Factory Wastewater, Patent

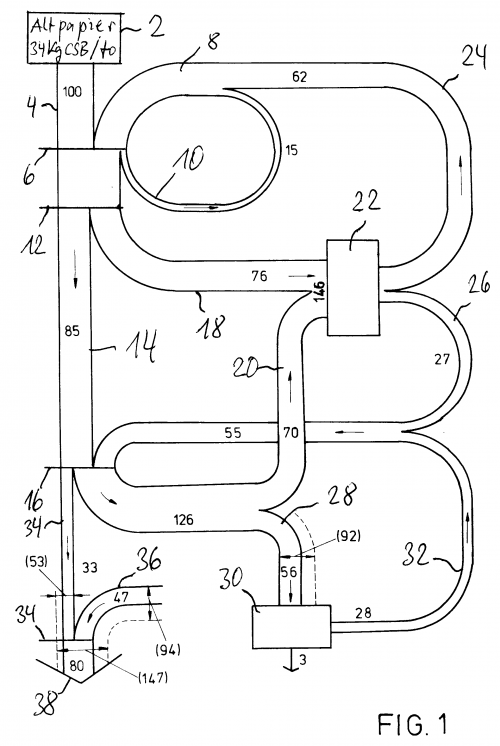
Browsing Google Patents can be fun, if you like long sentences… It also sometimes reveals a hand-drawn Sankey diagram, like this one:

This is from a patent filing EP 0494399 A1 on “Process to direct and treat production waters in a paper factory with installation for treatment of waste paper” by German inventor Wilhelm Menges.

The diagram is for a paper recycling process. The “thickening filtrate arising from the dispersion of waste paper is directly fed to a biological waste water” treatment. This reduces the COD levels.

Flow quantities are shown in printed numbers. A lot of hand-written numbers refer to process elements.

Electric Vehicle with Energy Recuperation

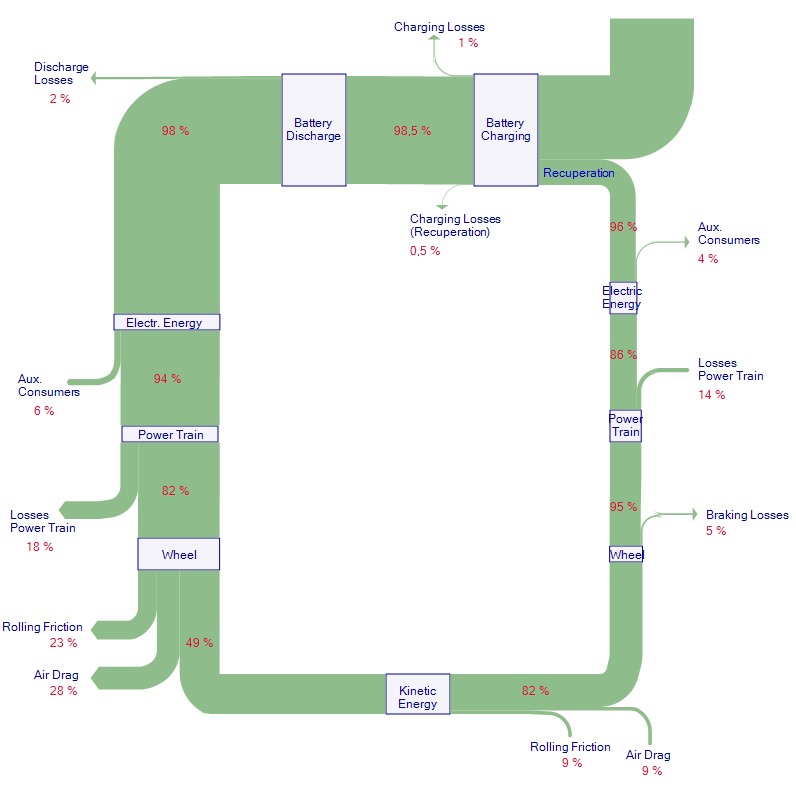
Preparing for a new assignment I searched for some ideas and came up with a diagram for an electric vehicle (EV). The original diagram is from a German text book on aerodynamics.

The Sankey diagram can be read counterclockwise starting at the top, where the vehicle battery is loaded. At every process step there are losses, the largest being rolling resistance and aerodynmic drag. When the driver brakes, energy is recuperated and fed back to the battery.

It took me some time to get this done, since the actual flow values were not explicitly given. Instead the energy efficiency and losses at each step are indicated as percentage values. Getting out my pocket calculator helped determine the values needed to setup the Sankey arrows.

Sankey Diagram Solar Panel System

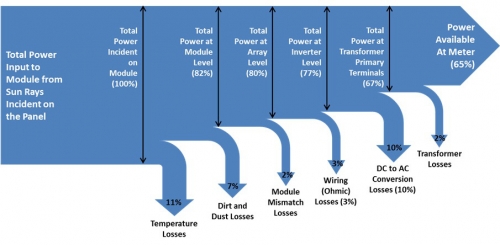
From Dr. Sanjay Vashishtha at Firstgreen Consulting blog comes this Sankey diagram on energy output of a photovoltaics (PV) system. The article on ‘Estimation of Solar PV System Output’ dates back to 2012.

Simple unicolor left-to-right diagram with losses branching out vertically to the bottom. At every step energy efficiency in percent is shown, leaving 65% of the primary solar radiation input as power at meter. Losses have a stronger emphasis due to arrow spikes.