Month: April 2016

Building Energy, Simple Sankey Diagrams

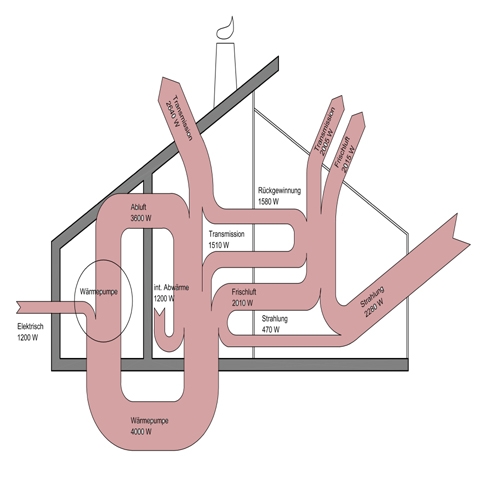
From my collection of Sankey diagrams here are three very similar samples depicting energy flows in a building. All three are from Germany (did I mention that more than half of the Sankey diagrams seem to be from Germany or Austria?).

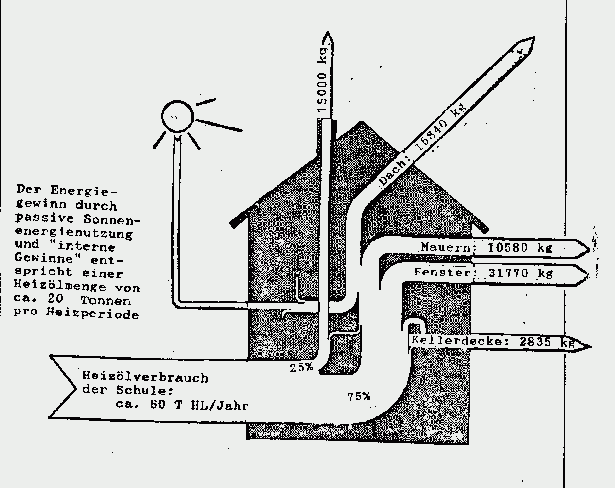
These are all very simple Sankey diagrams. This first one is a hand-drawn goodie from the times when reports were still done with a typewriter. It shows use of fuel oil (‘Heizol’) in a school building, and interesting to see, the flows are given in kilograms fuel oil rather than to represent the heating value. The school building consumes 80 tonnes of fuel oil per year.

Note that flows are not to scale (arrow for equivalent of 10580 kg fuel oil annual heat loss through walls is about the same width as the one representing 31770 kg heat loss through windows). So this Sankey diagram doesn’t deserve an A…


The next building energy flow Sankey diagram shows flows in Watts (W). Not sure where I found this one. Flows again are not proportional (spot the 470 W flow and compare it to the others). Main inputs are radiation (‘Strahlung’) and electric energy. A heat pump cycling energy can be seen, so it seems that this one is maybe for a passive house.

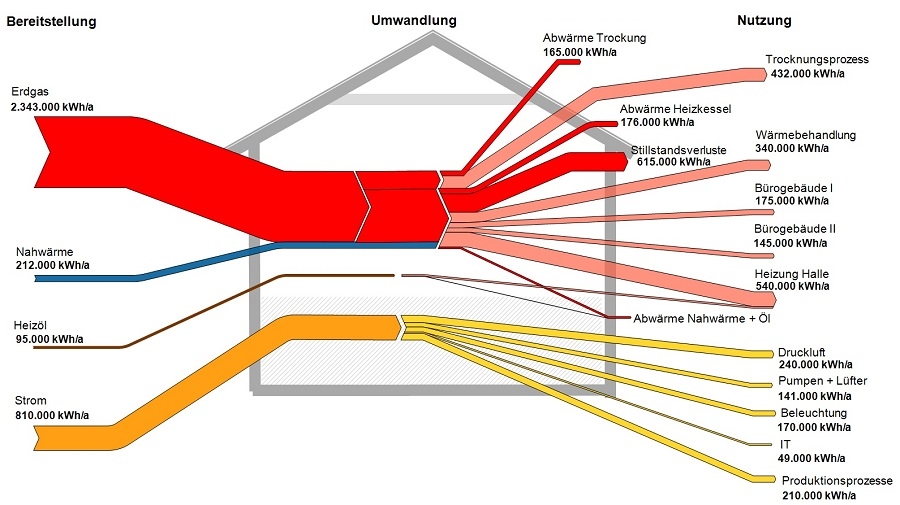
This last one done with a Sankey diagram software hence flows are to scale in this one (although I have some doubts regarding the width of the fuel oil input arrow on the left). Flows are in kWh per year. Main fuel type is natural gas (red), some district heating (blue). Electric energy in yellow, consumed by IT, lighting, air compressors, and so on. This energy flow Sankey diagram is probably for a factory building or complex.

I will try to add the sources where I found these three diagrams. Please forgive my negligence this time.
Lost Gem: Energy Analysis, Motiva

Digging out some gems from folders on my hard disk. I found this one back in 2010 or so, but had not documented the source properly – shame on me. I just know that it is from consulting firm Motiva. Had I really forgotten to feature this here on the blog?


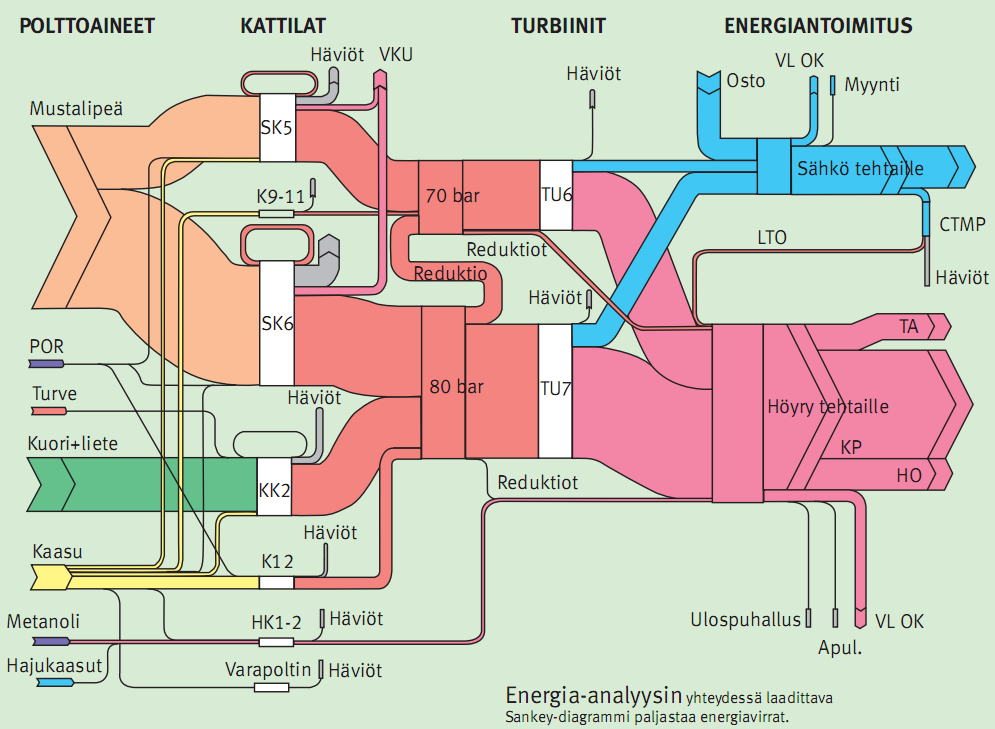
This one is the result of an energy analysis in a company. No numbers or units given in this diagram. Fuels by type on the left (‘polttoaineet’), then from left to right bunkers/tanks (‘kattilat’), two turbines (‘turbiinit’) generating electric energy (‘sähkö’) and steam (‘höyry’).

Heat Flow Retro Sankey Diagram Remake

‘Dubbel’s Handbook of Mechanical Engineering’ could be considered a bible for mechanical engineering students in Germany. Despite its 900 pages it is still called a pocket book (‘Dubbel – Taschenbuch für den Maschinenbau’) in German quite euphemistically. Since it was first published in 1914 by Heinrich Dubbel it has seen some 24 editions and roughly 920,000 copies sold. Since 1994 it is also available in an English translation from Springer Publishers.


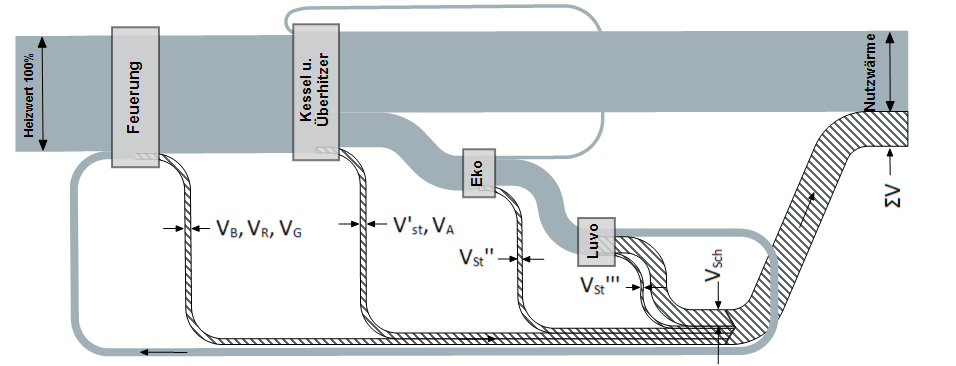
Someone challenged me, if I could do the above figure from Dubbel’s book (“Wärmestrom in einer Kesselanlage”, heat flow in a boiler system). I did various copies and here are the two I like best:

In this version losses are shown in grey with a gradient to dark grey.

The other one sticks closer to the original with the hatch pattern on the arrows representing losses. I had to fill the nodes since the contrast between the colored arrows and the hatched arrows was just too harsh.

I confess I couldn’t do the labels with prime marks and subscript directly in e!Sankey. So I did them in Word, created tiny images and rotated them as work around. Later I found out that the whole image was probably originally intended to be displayed vertically, but rotated to the left only to save space in the book.

Anyway … a fun challenge. I hope you like the result. Let me know your opinion.