Month: February 2018

Energy Flows in ZeroCarbonBritain

What would daily life in a ‘zero carbon’ Great Britain look like? Since 2007 the Zero Carbon Britain (ZCB) project of the Centre for Alternative Technology (CAT) has worked to “offer the hard data and confidence required for visualising a future where we have risen to the demands of climate science; to remove fear and misunderstandings and open new positive, solution-focused conversations.”

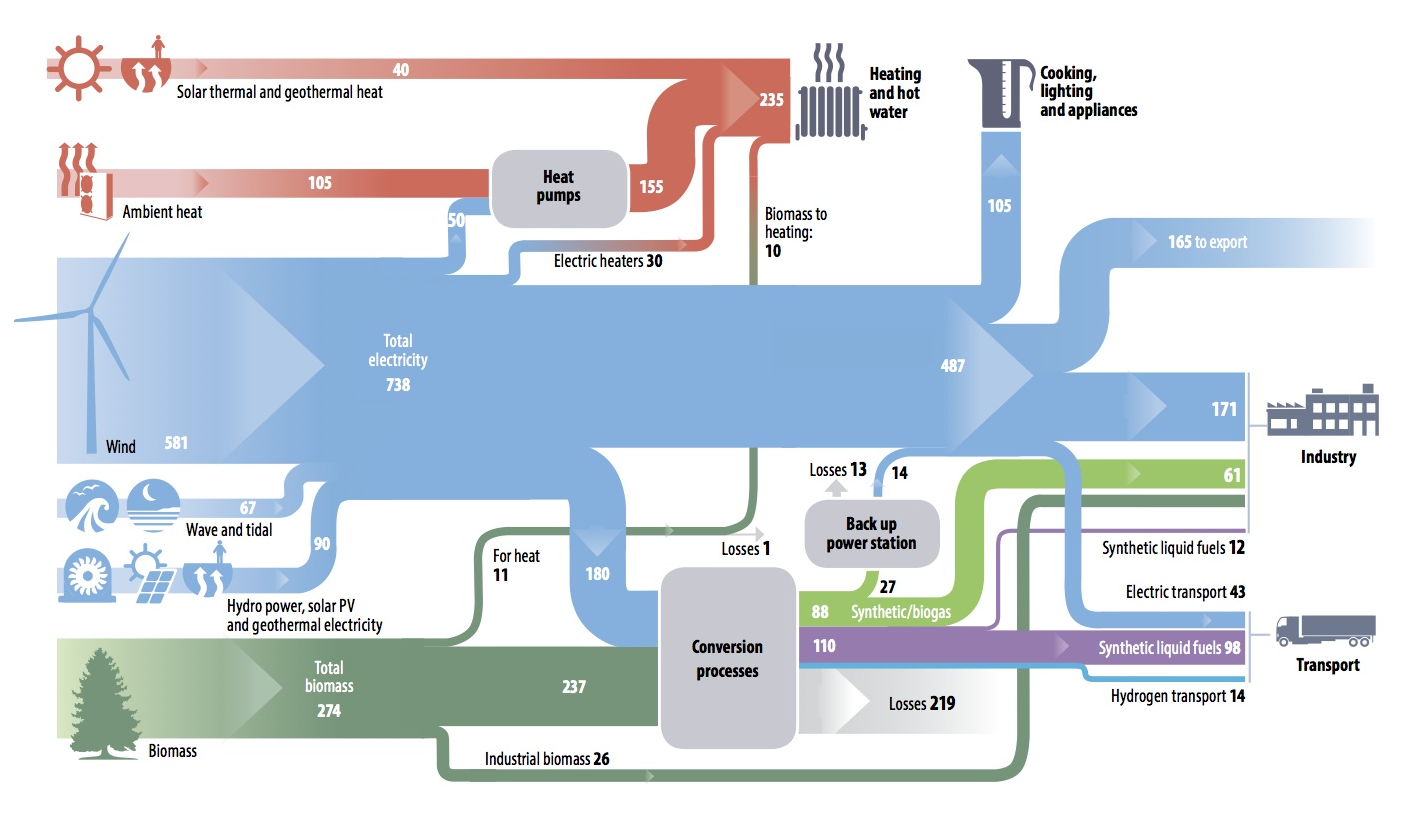
They have presented a Sankey diagram for the energy landscape in the UK, the way it could look like if Britain’s energy production was actually carbon free and 100% renewable energy.


via Open Energy Monitor blog, original image here (under CC BY-NC 2.0 license)

Flows are in TWh/year. The largest energy sources are wind and biomass. Some of the electricity is used to produce synthetic gas, synthetic liquid fuels and hydrogen (used mainly in the transportation sector). In that scenario there is even an electricity surplus that can be exported.

While I can not judge how realistic such a vision of the UK energy landscape is, I can at least say it is very different from the current situation (see here or here), and even from this UK 2050 energy scenario.

EU28 wood flows Sankey diagram

The European research project CASCADES’ objective was “to define the cascading use of wood and assess the environmental and socio-economic impacts of cascading, to identify and analyse the barriers preventing cascading”. As a central element of the project a wood flow analysis was conducted.

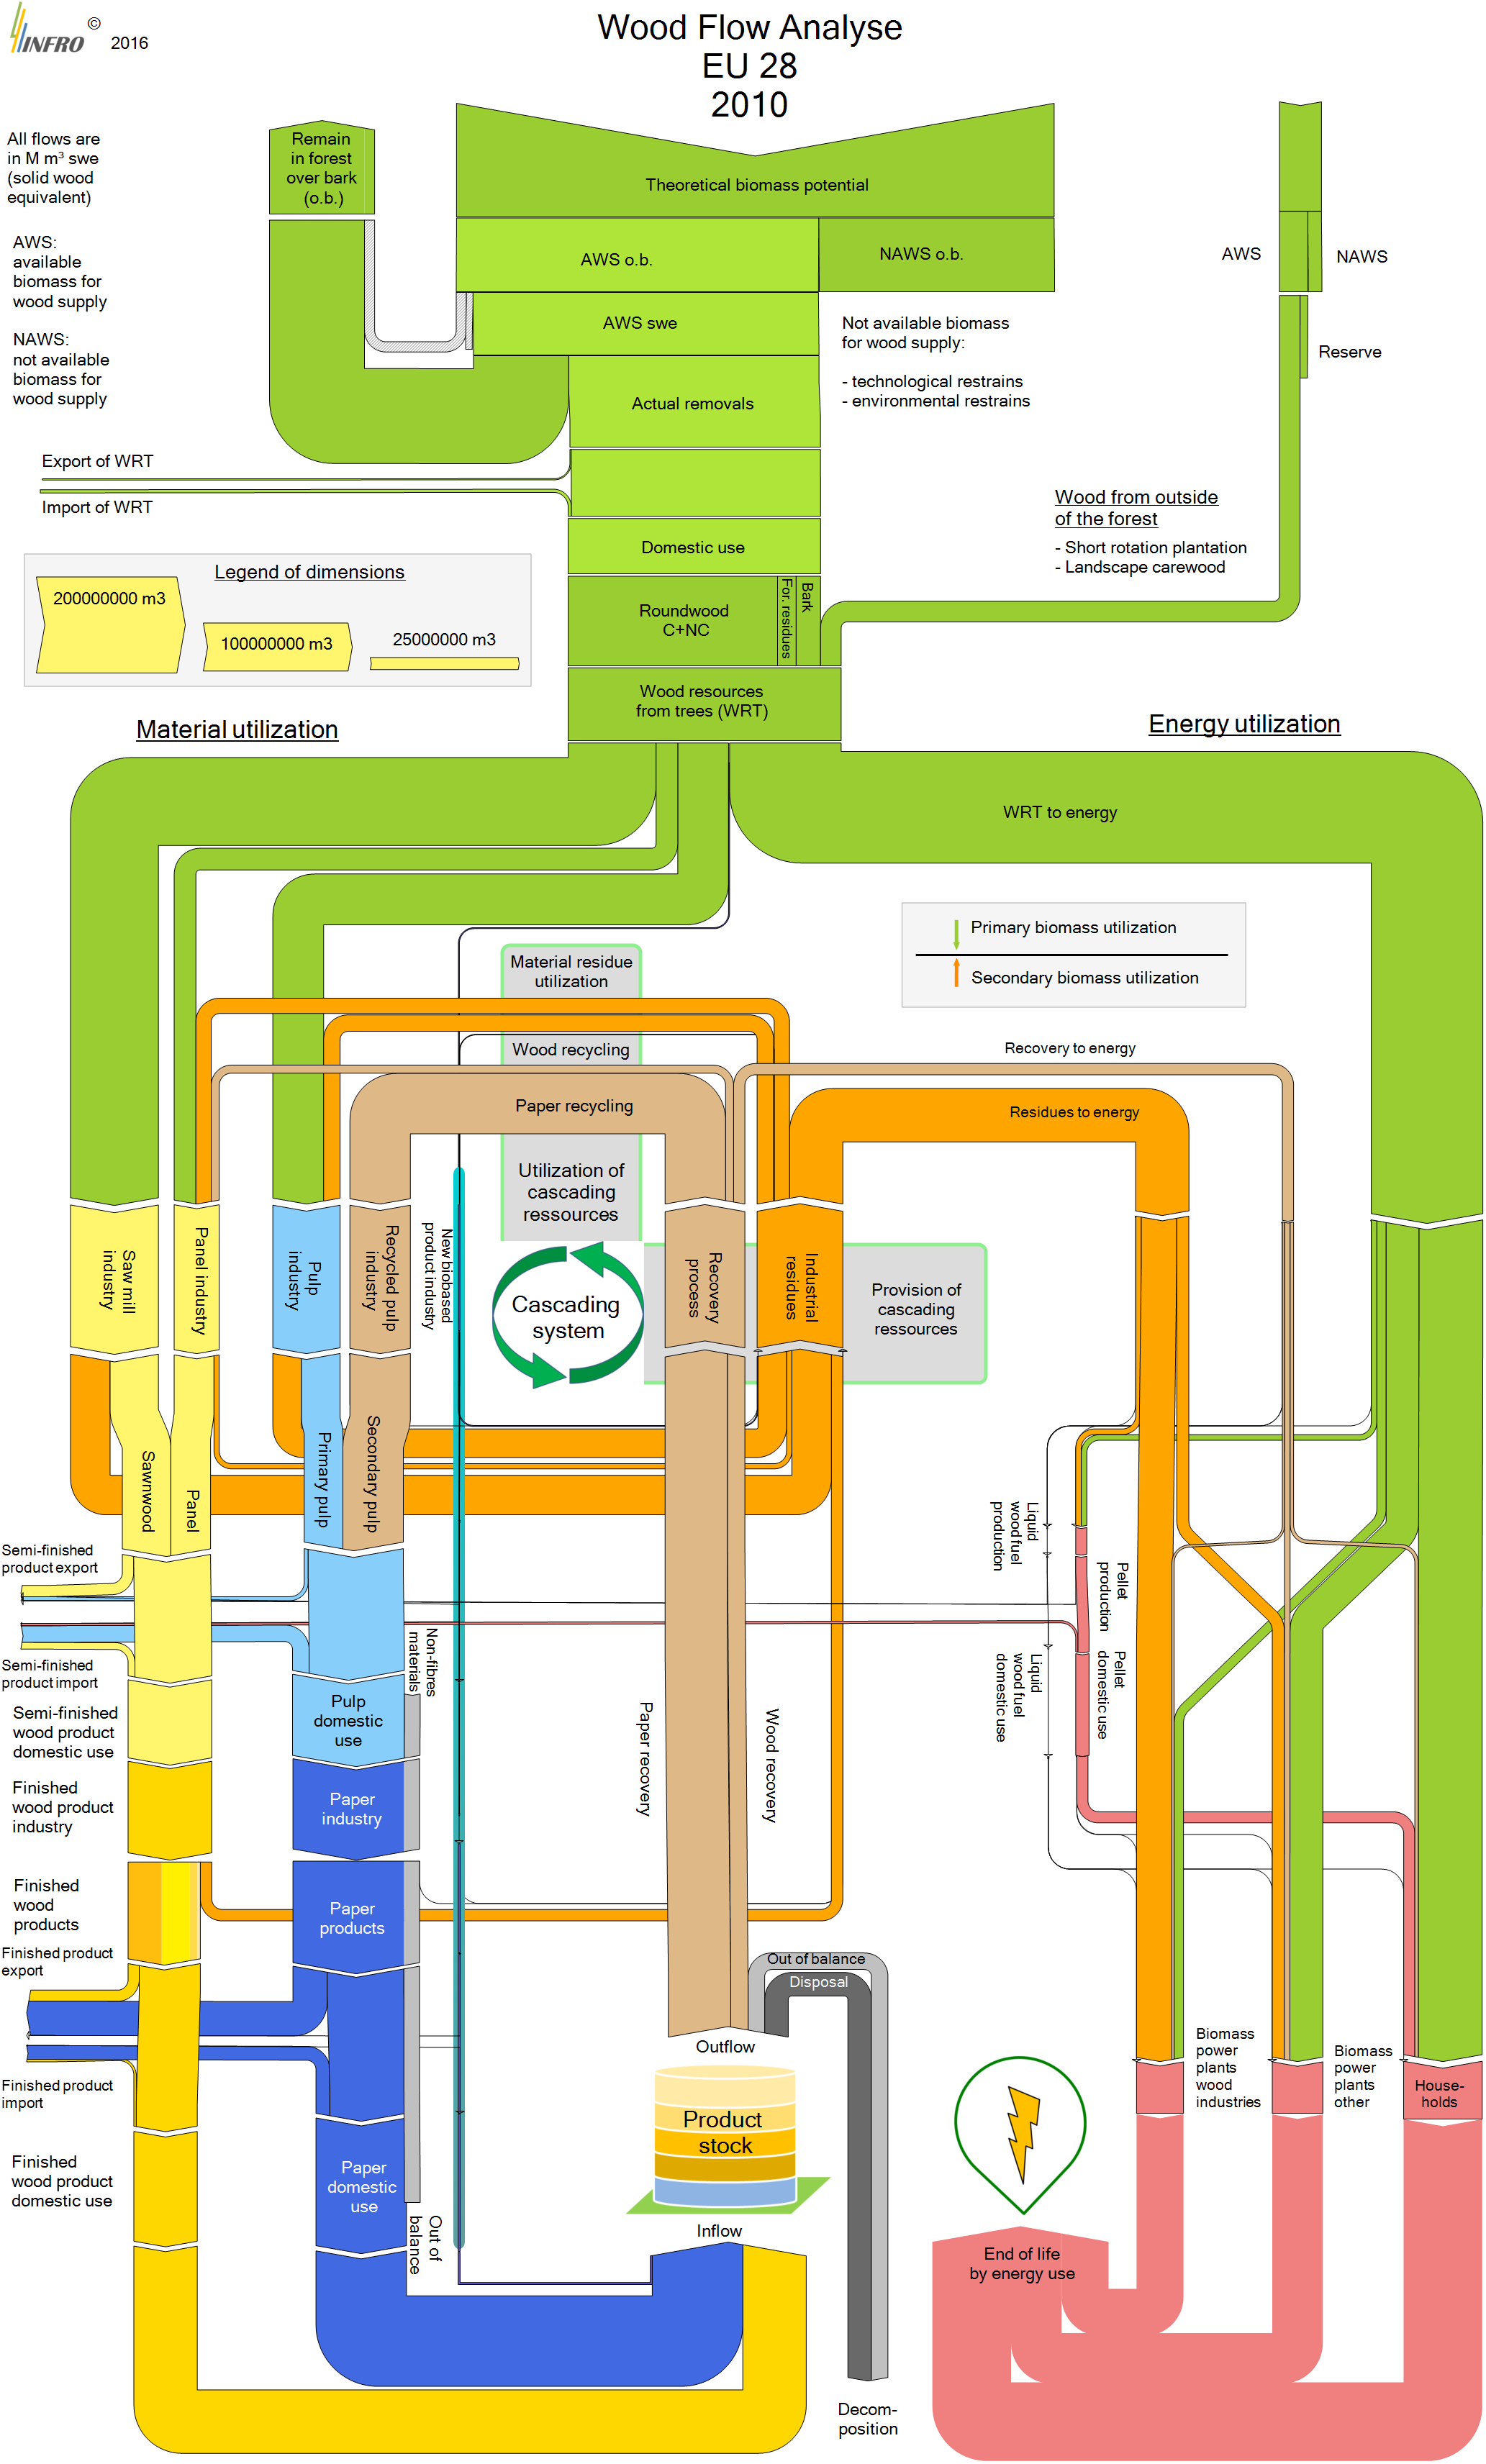
From page 26 the 2016 final report [Vis M., U. Mantau, B. Allen (Eds.) (2016) Study on the optimised cascading use of wood. No 394/PP/ENT/RCH/14/7689. Final report. Brussels 2016. 337 pages)] comes this Sankey diagram depicting wood flows in the European Union (EU-28).

All flows are in Mm³ swe (solid wood equivalent). No absolute numbers are given to quantify the flows, instead three sample arrows serve a reference to the scale (“Legend of dimensions”).

The wood biomass is either used as material (left branches) or as energy (right branch). On the material side wood industry (yellow path) and paper industry (blue path) take up most of the biomass. Residues of both industries along with a good chunk of the post-consumer paper waste are being recovered and led in a cascading loop, until they eventually shift to the energetic side.

A complex and interesting Sankey diagram with much to discover. The CASCADES report describes all the areas of the wood flow system, identifies hotspots and describes measures for optimization.

Europe JRC Critical Materials Report

Europe’s Joint Research Centre (JRC) has published a new report on ‘Critical Raw Materials and the Circular Economy’ in December 2017.

The report also builds on findings from a 2015 study by BIO by Deloitte, where a Raw Material System Analysis (MSA) Framework had been introduced that “investigates the flows and stocks of 28 raw materials from ‘cradle-to-grave’, that is, across the entire material life cycle from resource extraction to materials processing to manufacturing and fabrication to use and then to collection, processing, and disposal/recycling”. I had posted about this here.

Like in the 2015 study the authors present MSAs for a number of critical materials (CRMs) within the EU-28 boundaries and are depicting them as Sankey diagrams. The authors then expand into how scarcity and price may impact certain industrial sectors or products (Automative, Electronics, Batteries, etc.). Best practices are suggested for recovering critical materials.

Here is the MSA Sankey diagram for Germanium (from page 41 of the report):


All flows are in kilograms per the reference year 2012. We can see that roughly 80.000 kg of Germanium entered the EU in the year 2012, and 15.800 kg were made available on the secondary material market within the EU.

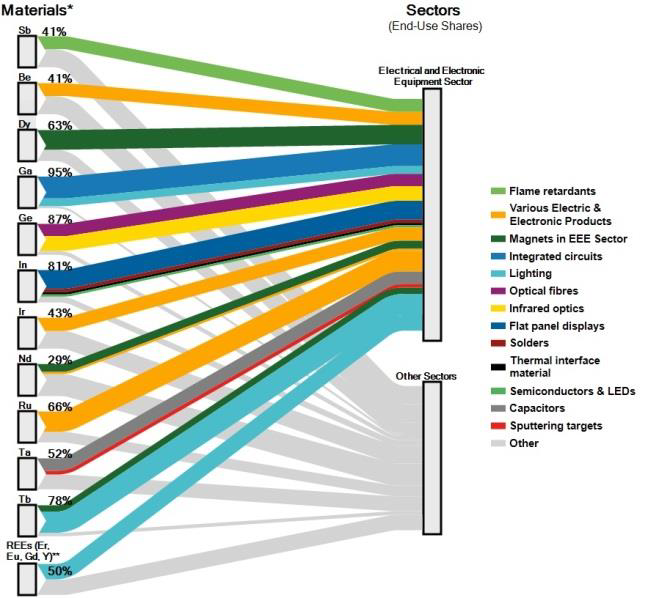
For the individual industrial sectors, another type of figure is presented. This breakdown of how much of the CRMs is used in a specific sector gives a better understanding of the dependency on certain CRMs.

This Sankey diagram (from page 39 of the report) for the Electrical and Electronical Equipment sector shows, for example, that 87% of the Germanium (ge) entering the EU are used in the EEE sector, making it the largest consuming sector of Germanium. The remaining 13% are used in other sectors:

Crossing the information from the MSA Sankey diagams that show availability of a CRM, and the information from the Sankey diagram showing demands per sector gives a good understanding on why some materials are considered critical for industries, and measures for recovering more of them from tailings or waste are meaningful.

Source: Mathieux, F., Ardente, F., Bobba, S., Nuss, P., Blengini, G., Alves Dias, P., Blagoeva, D., Torres De Matos, C., Wittmer, D., Pavel, C., Hamor, T., Saveyn, H., Gawlik, B., Orveillon, G., Huygens, D., Garbarino, E., Tzimas, E., Bouraoui, F. and Solar, S., Critical Raw Materials and the Circular Economy – Background report. JRC Science-for-policy report, EUR 28832 EN, Publications Office of the European Union, Luxembourg, 2017, ISBN 978-92-79-74282-8 doi:10.2760/378123 JRC108710.

Access JRC report here (PDF).