Month: June 2018

FIFA Worldcup 2018 Prediction Sankey

Every four years soccer related Sankey diagrams pop up. For the 2010 FIFA worldcup in South Africa I featured this figure. In 2014 there was the beautiful “The Road to Rio” diagram from an inflight magazine.

For the upcoming 2018 FIFA worldcup in Russia, two researchers have taken a more scientific approach. Their prediction model uses mathematical methods to determine who will most likely be handed the gold trophy on July 15 in Moscow. If you are into Monte Carlo simulations, bivariate and nested Poisson regression models, Brier score and Rank-Probability-Score (RPS) then you will enjoy the paper ‘On ELO Based Prediction Models for the FIFA Worldcup 2018’ by Lorenz A. Gilch and Sebastian Müller.

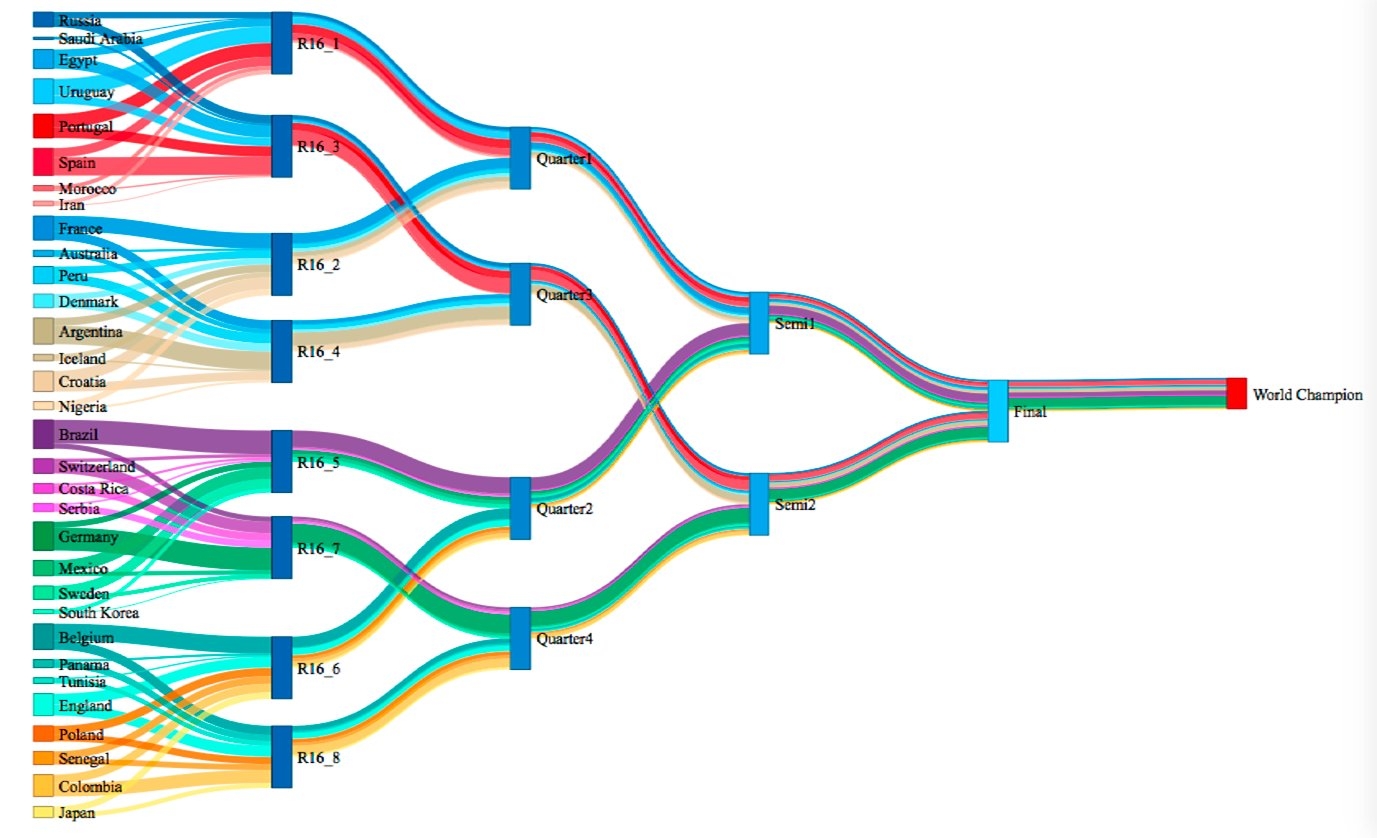
All others can just skip and go directly to page 22 of the paper to find this Sankey diagram based on 100.000 simulation runs:


via Twitter user @ggojedap

Groups and teams are color-coded, and the wider the band in the Sankey diagram, the higher the probability. So, according to this model, which takes into account performance of the teams since 2010, a nation from the green group will become the world champion. Purple runs with a probability of 18% and red with 14% (for the detailed values that form the basis for this diagram please see table 12 on page 15 of the paper).

Well, we’ll see, and in five weeks we will know the outcome. Whether you trust this more scientific approach, or whether you would rather go with a straight-forward Paul the Octopus divination … I hope you enjoy watching the matches!
Biogas in Auvergne-Rhône-Alpes region

The French region Auvergne-Rhône-Alpes in the south-east of the Hexagone borders with Switzerland and Italy. Lyon and Grenoble are located in this region, known for skiing, lush pastures … and great cheese!

Auvergne-Rhône-Alpes Énergie Environnement (AUR-EE) is a regional agency that works to bring together players in the renewable energy field and to promote RE projects.

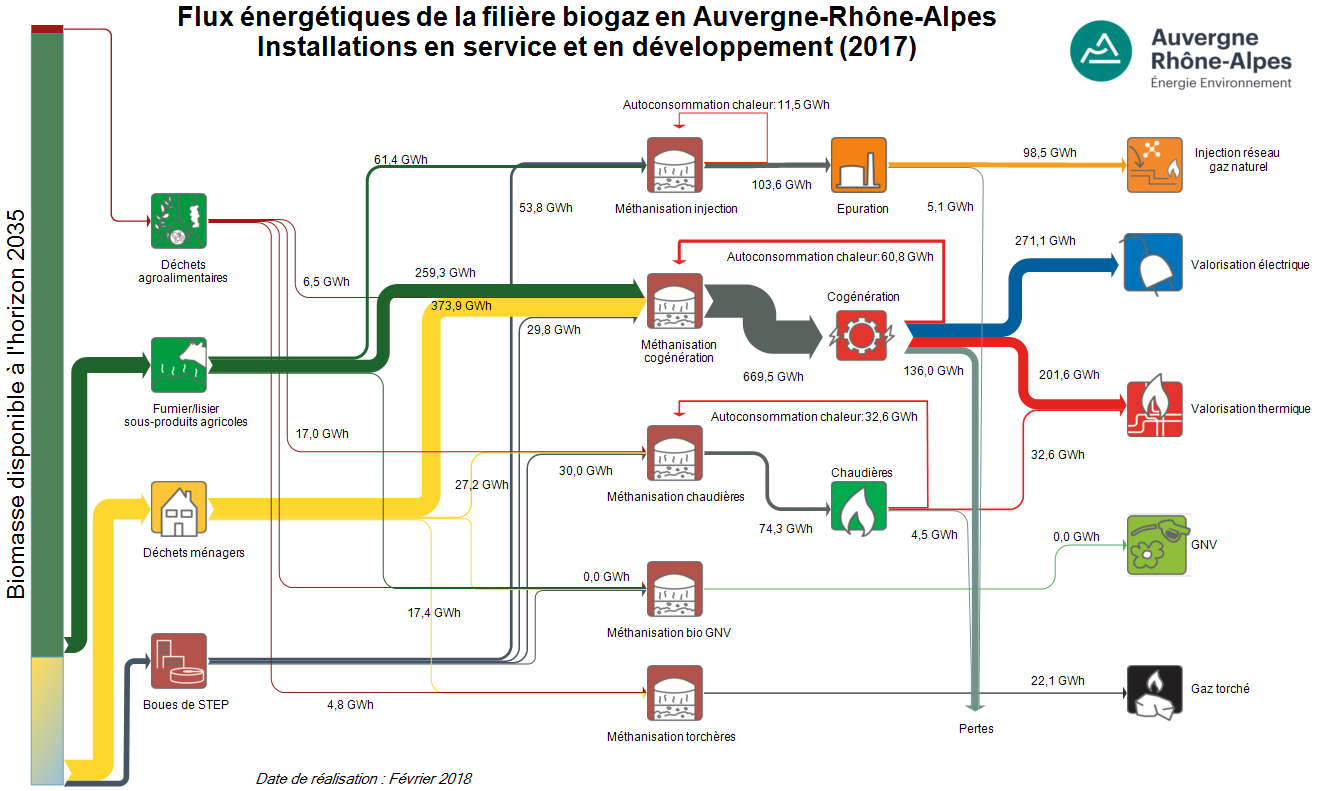
Given the agricultural character of Auvergne-Rhône-Alpes, biomass use for energy generation has been going strong in recent years. The agency has created energy flow Sankey diagrams for existing biogas installations, as well as a projection for the ones being under development.

Data is for 2017 and for the scenario where all projects currently under development would already completed. The yellow stream (‘déchets ménagers’) is household waste, providing 374 GWh of energy. Manure and other side-products from agriculture (green arrow) contributes another 260 GWh.
The stacked bar on the left hand side of the diagram indicates the potential availability of biomass by 2035, and one can see that only a small fraction of it is currently being taken advantage of.
Biogas is produced in anaerobic digesters (‘méthanisation’) and the region yields some 271 GWh electricity and 200 GWh heat per year from cogeneration plants. Already almost 100 GWh of biogas could be injected to the natural gas network, allowing for storage of the energy.

Note that smaller or even negligible flows are still shown with a minimum width in order to make them visible (these thinner arrows are not to scale with the others).