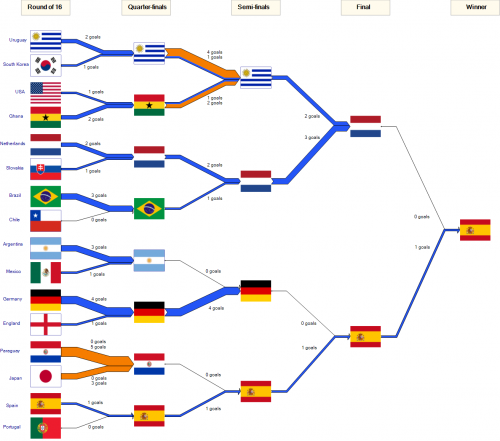
Following up to my last post after the knockout of the 2010 FIFA world cup. Well, things have cooled down a bit now, so here is the completed Sankey diagram showing the tournaments goals.
As one commenter put it, you can “see that Spain’s road to success is a rather boring one (a thin line of 1:0 wins) while Germany was pretty inefficient (big lines, no gain).”
Drawing this was fun, although I was not happy to see my favourite team drop out in the quarter finals already…
In doing the Sankey diagram I found it difficult to handle null flows (that is, explicit zeros, not “no value”) in a Sankey diagram. Also I am not happy with the differentiation of regular goals and penalty goals (brown Sankey arrows). Maybe I’ll come up with a different presentation in time before the 2014 worldcup in Brazil…. 😉

3 Comments
I don’t like football but the diagram is perfect, in simply and clearly shows everything.
Nice diagram =) Good colors.
Comments are closed.