I am always getting excited when I have a new e-mail with a Google alert for Sankey diagrams. This time I was directed to this blog post.
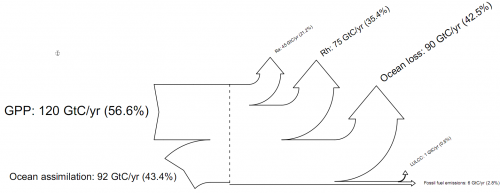
SankeyR is a function for the R open source statistical computing and graphics package based on the drawSankey routine for Matlab developed at EPFL. Aaron Berdanier at Colorado State adapted it to work with R. It produces simple left-to-right Sankey diagrams like this one:
The routine creates a plot in R, or can be outputed to bmp or pdf format. “Inputs do not need to equal losses. Any difference will be displayed as a discrepancy in the height of the left and right sides of the diagram. This capability enables the developer to examine imbalances in flows.”
Get the source from Aaron’s blog.
I have added SankeyR to the Sankey software list. Thanks Aaron for sharing this with the R community. I am just not sure how what to make of the blog name…
