Month: January 2020

Resource Imports into China 2014

With all the news and discussions about trade balance and tariffs and exports of goods from China to the U.S. we mustn’t forget that China is also a large importer of resources from all over the world.

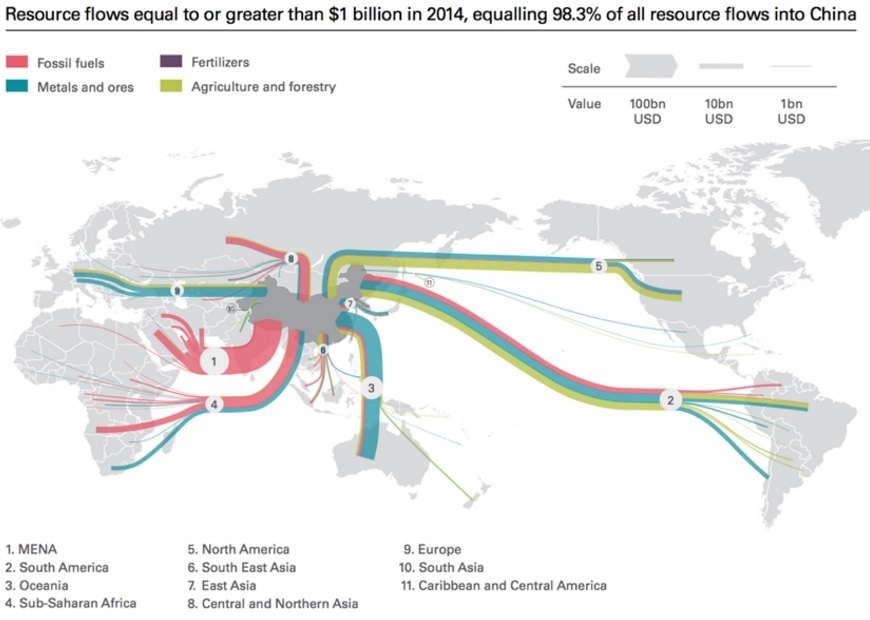
The below Sankey diagram is a good visualization of the resource dependencies and import such as fossil fuels, minerals and ores, as well as agricultural / forestry products. I found it in an article on the Diálogo Chino blog but it was originally published in a 2016 report ‘Navigating the New Normal: China and Global Resource Governance’ by Wei Jigang et. al. published jointly by Development Research Center (DRC) of the State Council of the People’s Republic of China and The Royal Institute of International Affairs Chatham House. The image from an article ‘Will China’s new Silk Road be green?’ by Lily Pike on Diálogo Chino is republished under a Creative Commons license.

All Sankey arrows run towards China (imports in 2014) and flows are color-coded to show the resource type. There are no absolute numbers, but the value of goods imported in billions of USD is represented with a clustered scale that shows three representatives 100 bn USD, 10 bn USD, and 1 bn USD. The largest (in terms of value) stream is from the Middle East, while Latin America and Australia are the second and third largest regions delivering resources to China.

The original report is here with the image on page 64 and more detail on the data.
Paper and Cardboard Streams Germany 2013

German Environment Protection Agency (Umweltbundesamt, UBA) has published the final report of its project “Resource conservation through material flow-oriented secondary raw materials management” (German: “Stoffstromorientierte Ermittlung des Beitrags der Sekundärrohstoffwirtschaft zur Schonung von Primärrohstoffen und Steigerung der Ressourcenproduktivität”).

The study had been commissioned to three research institutes that were tasked to “analyse the Federal Statistical Office’s waste statistics … and carry out detailed investigations for 30 materials with focus on determining the recovery routes of these secondary raw material quantities and their derived substitution potentials.”

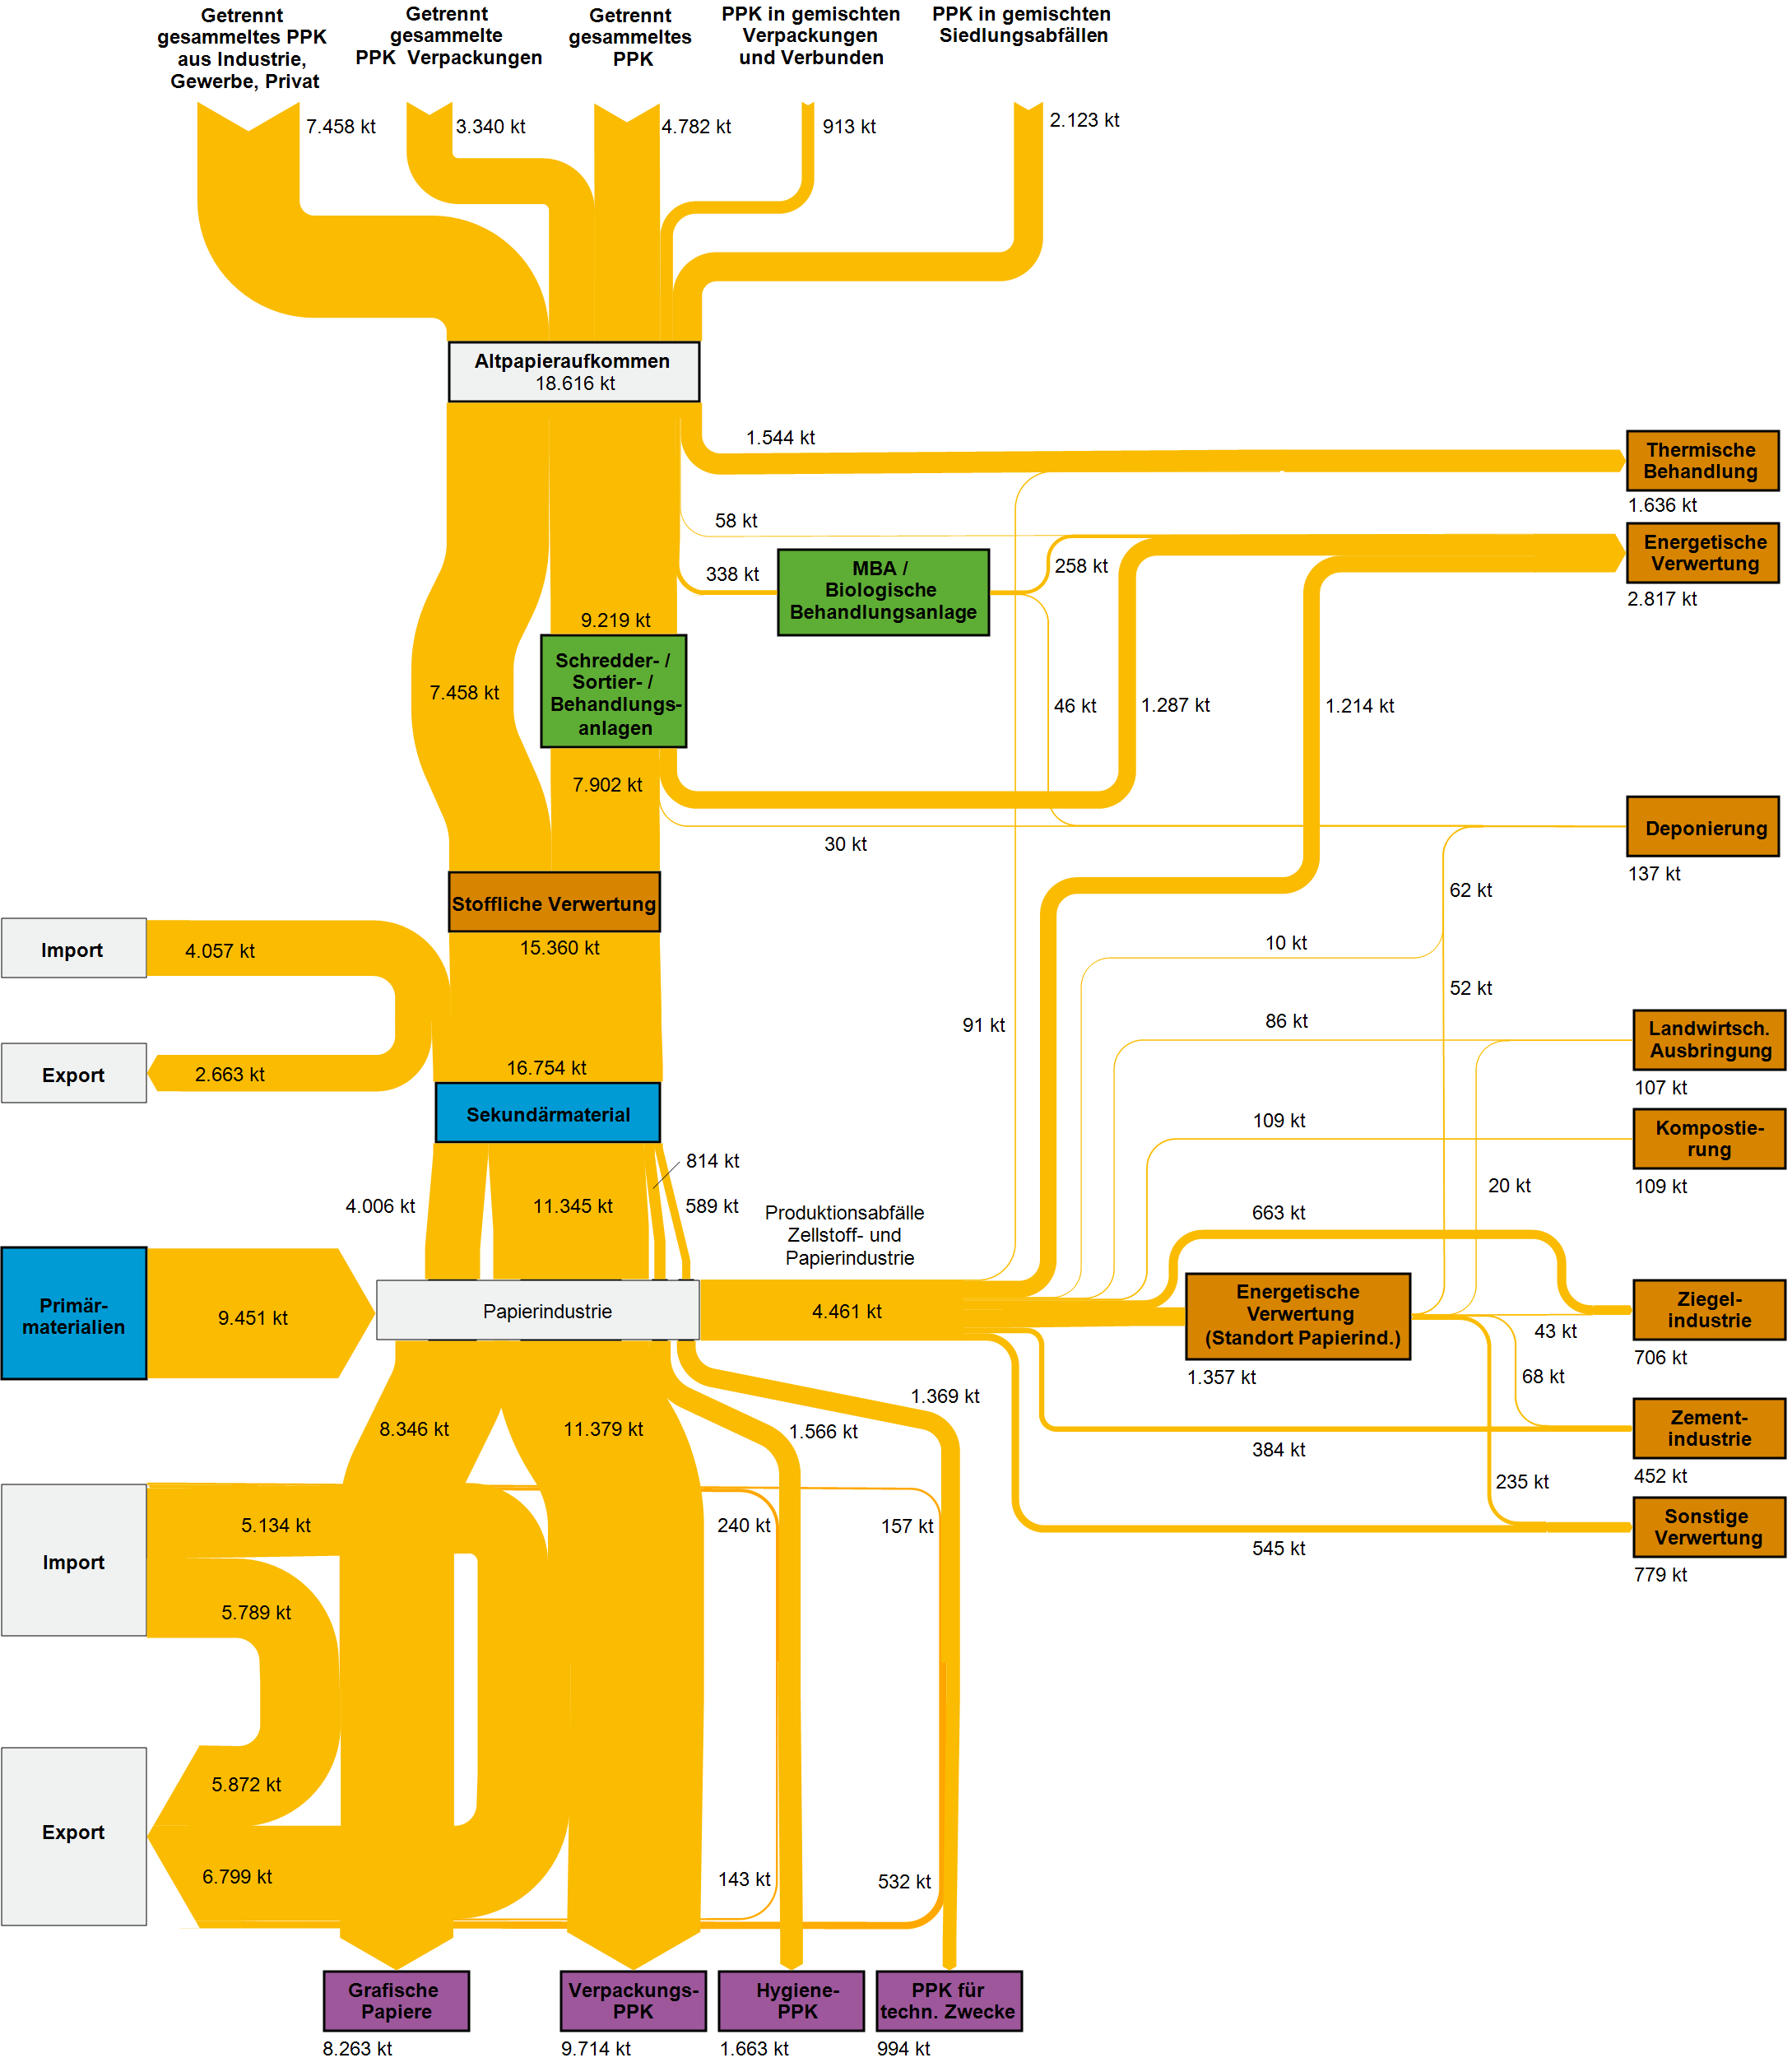
The report is gold for Sankey diagram aficionados: For all of the thirty materials analysed we can find Sankey diagrams depicting the streams through the economy and different recycling paths and secondary use options. Here is an example for paper and cardboard.

Flows are in kilo tonnes (kt) of material in 2013 in Germany. Inputs at the top are sources of paper fibres from waste collection. The general direction of flow is top-to-bottom with energetic use and reuse in other industries branching out to the right (brown boxes). Imports come in from the left and exports leave to the left again. Interesting to see, for example, that exports of graphical paper products almost exactly match the imports, while packaging paper exports (see stream to purple box “Verpackings PPK”) are slightly higher.

Beautifully crafted Sankey diagrams. A pity this isn’t available in English, but for those who love these self-speaking diagrams, here is the link to access the full report. Enjoy!

Waste Water Treatment Plant Sankey

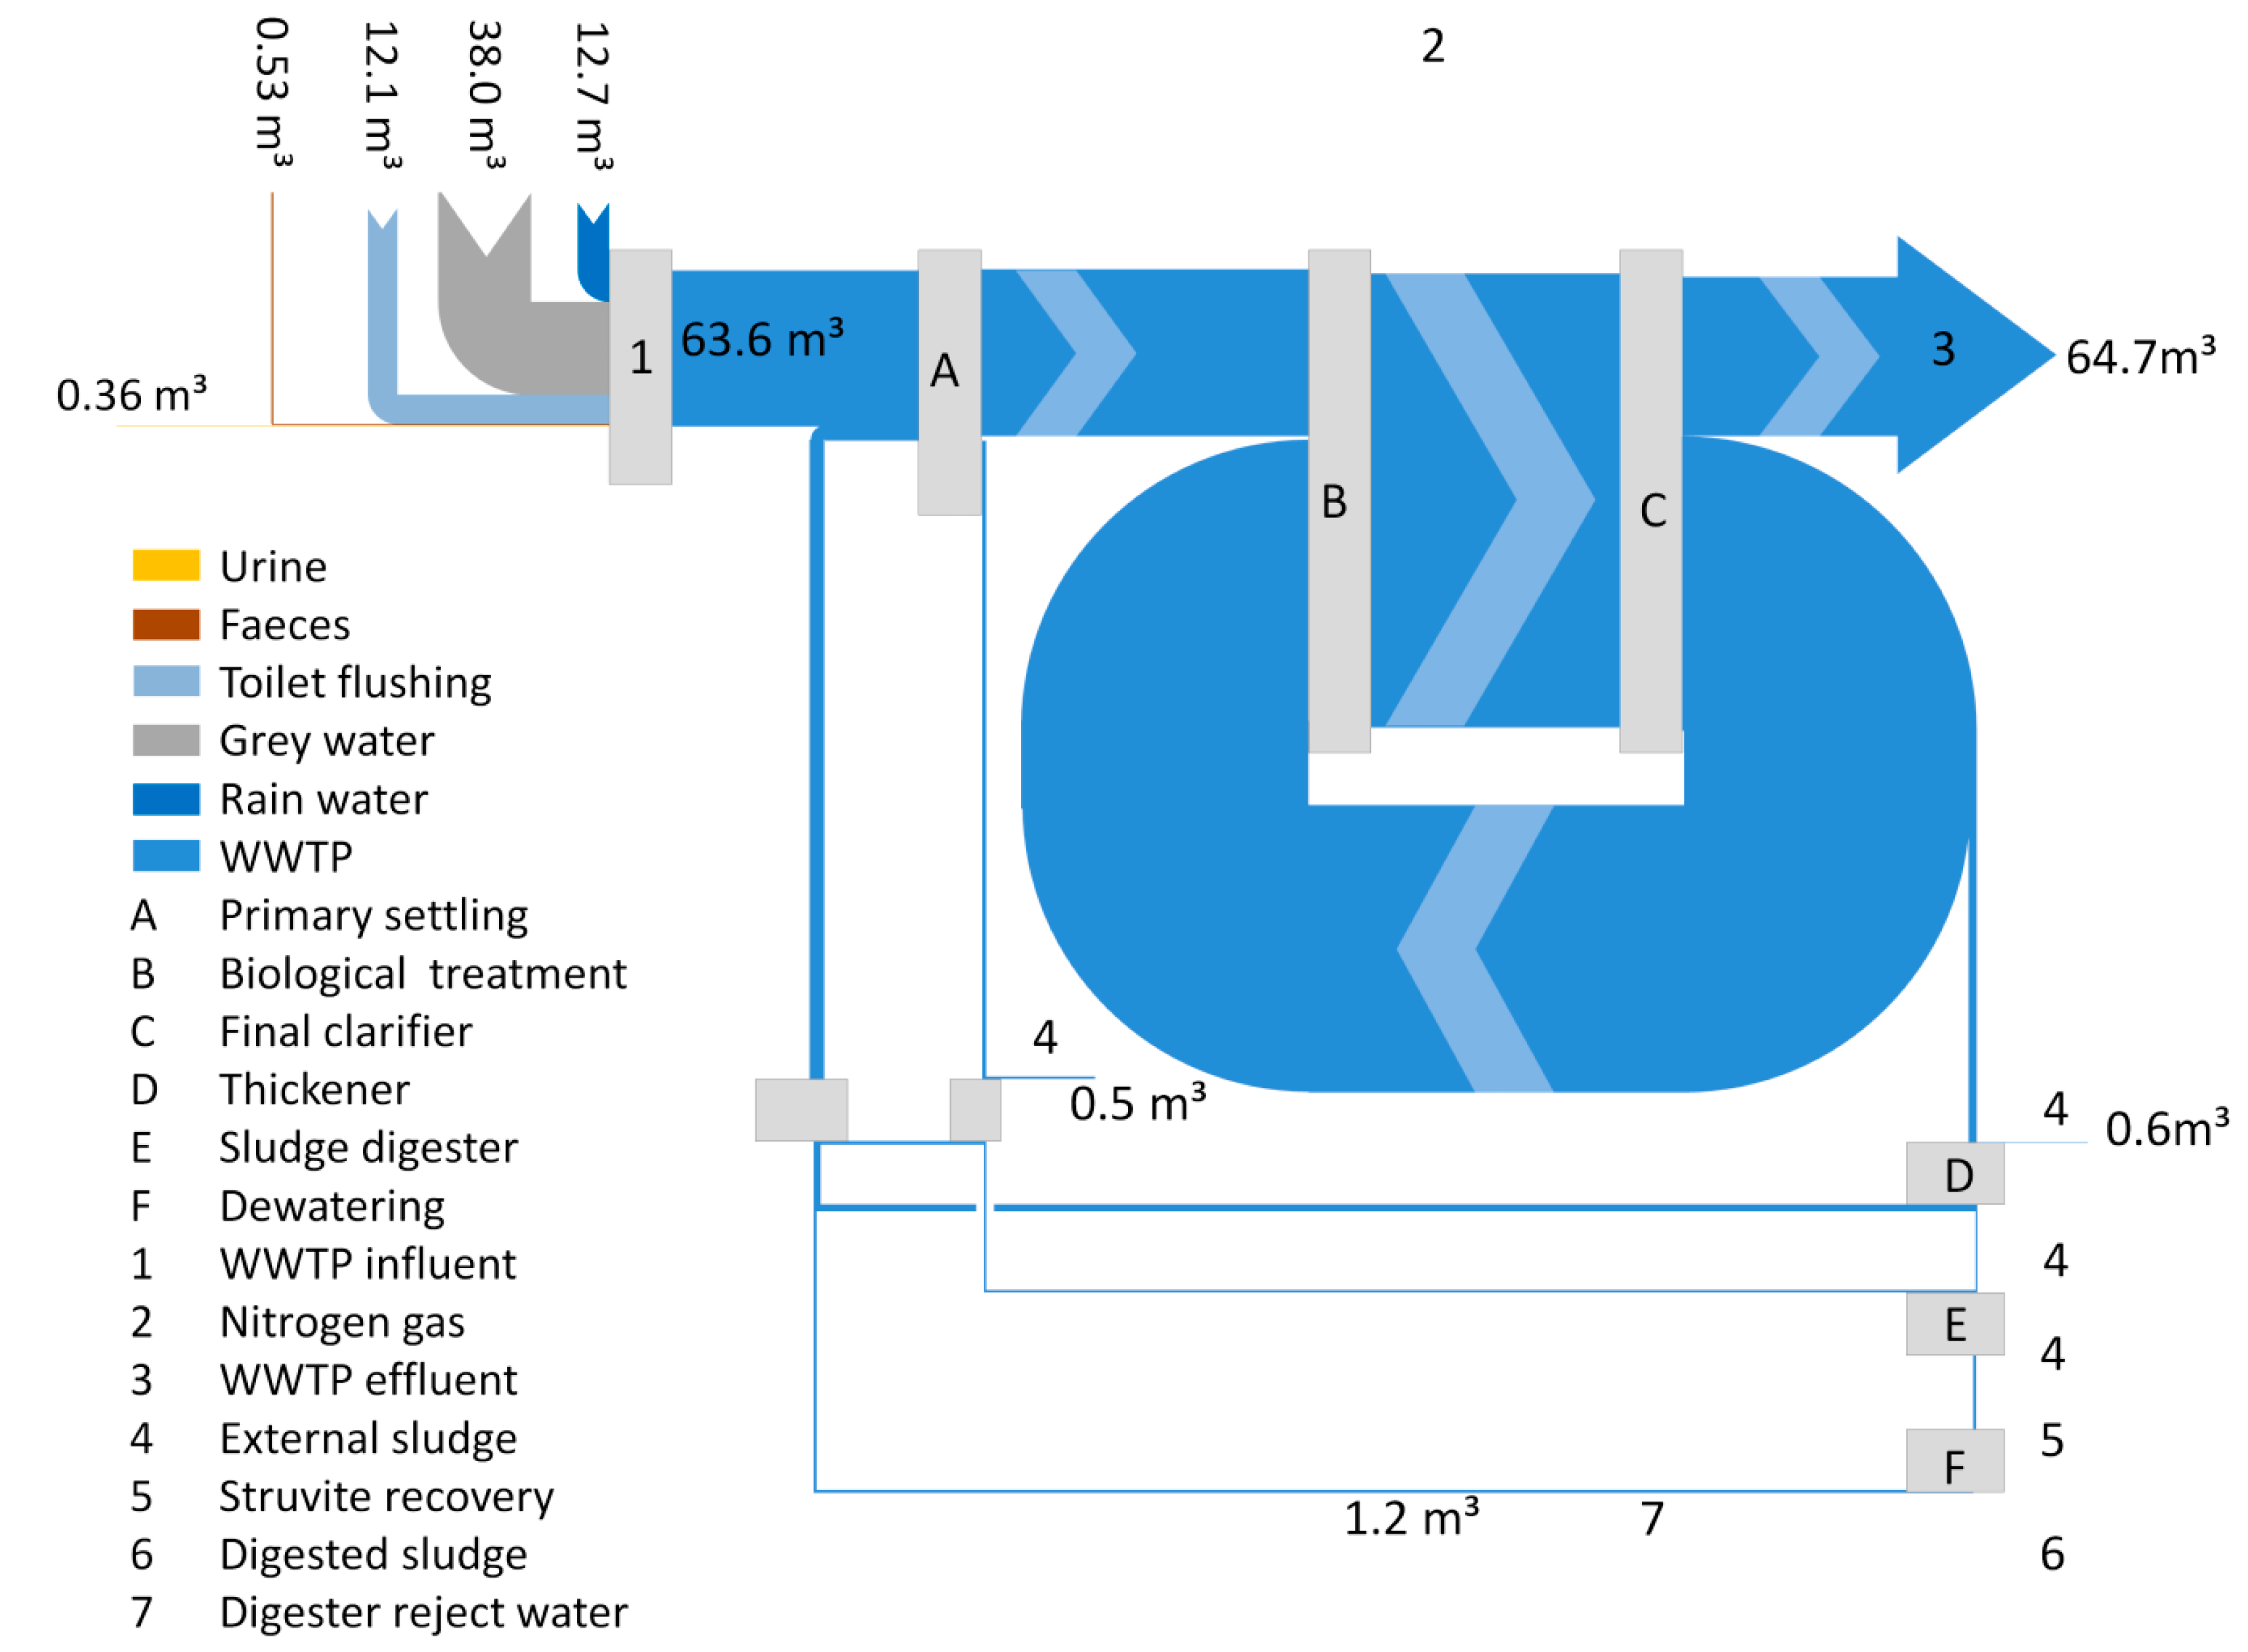
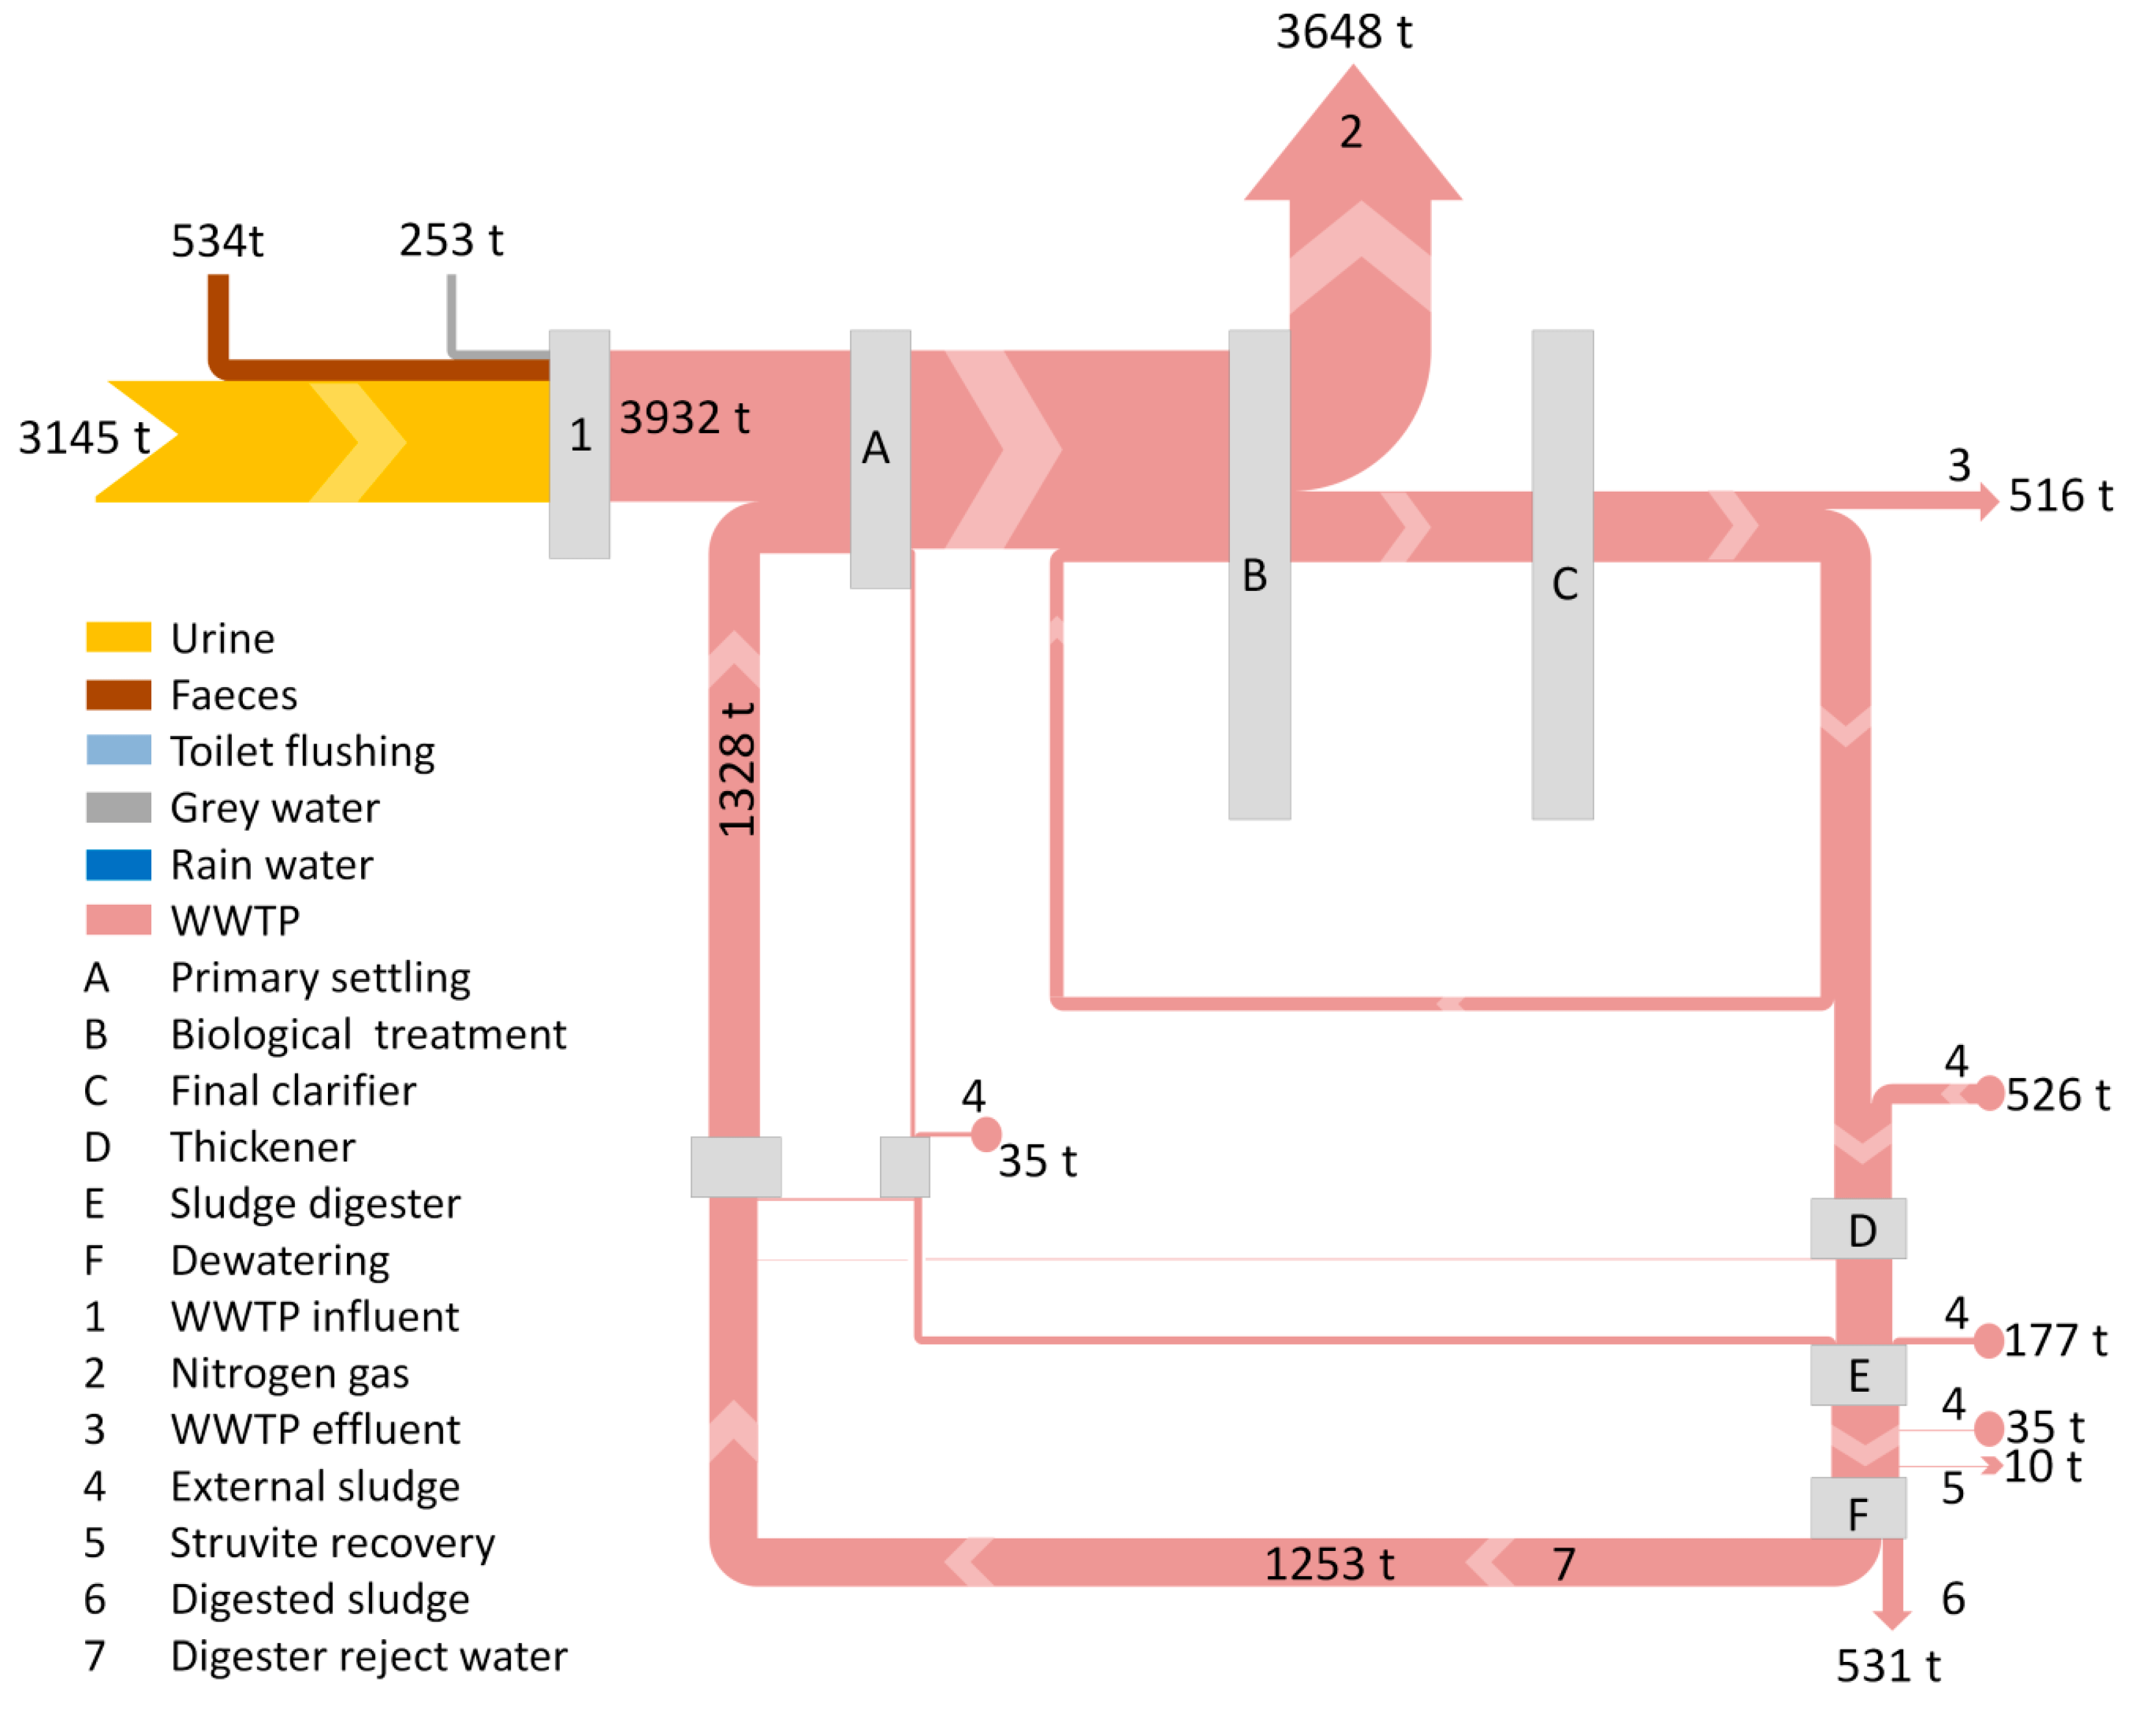
An area of application for Sankey diagrams that has (so far) received little attention here on the blog is waste water treatment. The article ‘Nitrogen Recovery from Wastewater: Possibilities, Competition with Other Resources, and Adaptation Pathways’ by Van der Hoek, J.P.; Duijff, R.; Reinstra, O. In: Sustainability 2018, 10(12), 4605 has two Sankey diagrams that merit being featured here.

The first one visualizes the absolute flows through the process in mio m³ per year (volume streams). Data is from the Amsterdam-West waste water treatment plant (WWTP). The main loop leads water from the clarification stage back to the biological treatment stage.

The second Sankey diagram uses exactly the same process structure, but flows are displayed in tons of nitrogen per year. Most of the nitrogen leaves the system as a gaseous effluent. In contrast to the above, the loop of nitrogen loads is in the reject water from the digester fed back to the primary settling stage.

Anyone in for calculating the concentrations? Read the full article here for details.