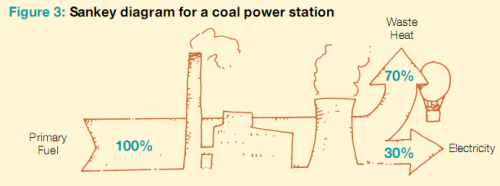
Browsing for more Sankey diagram goodies the other day I was delighted to find the following sketch in a brochure ‘Let’s learn about energy: a practical handbook for teachers’ published by the TACIS technical dissemination project.
The diagram illustrates a list of suggested activities for students, to teach them “why energy is important”:
Get students to draw up Sankey diagram (Figure 3) showing the energy flows through a process or activity. Consider a power station, house or car. The width of the arrows represents the amount of energy. Energy inputs (fuels, electricity) usually flow into the process from the left and useful energy outputs (heating lighting mechanical power, chemical energy) and losses (heat, noise etc.) flow out to the right.
And another language for my collection of Sankey definitions…
