Following up to my recent post on cogeneration Sankey diagrams from Czech websites, here are a few more.
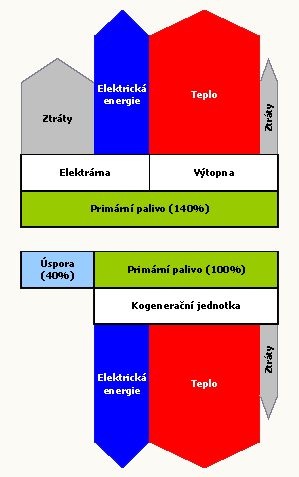
First, a rather simple one which has some fancy arrow heads, partly overlapping other arrows. This one is from the CEZ Energo website and just a schematic visualization of the cogeneration principle.
The next one has a strictly vertical orientation and is built from rectangles and simple block arrows. It uses the same values as in the diagram I shows in the last post. Found on the Plzenska Energetika website.
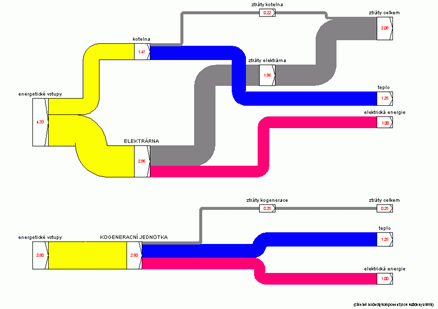
The last one can be found on the TZB Info engineering website. Actually there are two separate Sankey diagrams being compared. A left-to-right orientation, the flow quantities labels sit on the node. This is the only one drawn with a Sankey diagram software (judging from the node symbols I would say it is most likely the discontinued Sankey 3.1 by Fichtner)
If you find other cogeneration Sankey diagrams pls drop me a line…


