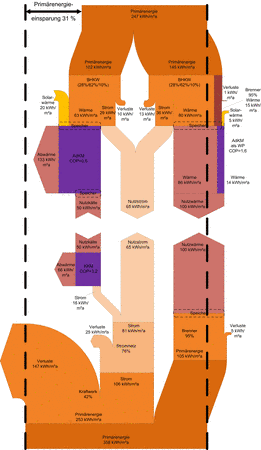
The summary of a research project under participation of Kempten University of Applied Sciences is presented on a project webpage. It also features this comparison Sankey diagram.
These are in fact two Sankey diagrams “mirrored” at an imaginary horizontal center line. The bottom one facing upwards is the diagram for the baseline representing convential energy systems. The upper one with flows pointing downwards has the same amounts of useful energy (trigeneration 30 % electricity, 47 % heat und 23 % cold), but using 31% less primary energy (see black dashed lines).
