Cummins Power Generation and Versa Power Systems are teaming in the development of a Solid Oxide Fuel Cell (SOFC). The three-phase SECA project, funded by the DOE/NETL (US DOE SECA DE-FC26-01NT41244) has completed its first phase. A prototype (named Mission 1) has been developed that produced 3.2 kW of electrical power over 1500 hours test operation time, with an availability of 99%. The ultimate goal is to built a SOFC power system that provides 10 kW.
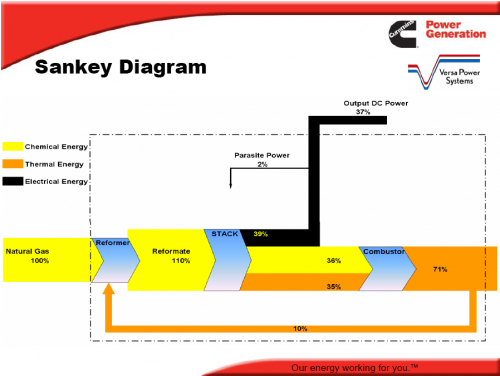
The Sankey diagram below is reproduced (courtesy of the author) from a presentation that summarizes the findings of the first phase of the project.
The Sankey diagram distinguishes chemical energy, thermal energy and electrical energy (as output) and shows the processes reformer, stack and combustor. Some of the heat from combustion can be recovered and used in the reformer. The orange arrow leaving the system at the right should actually be thinner, as 10% branches off. Unfortunately the arrow magnitudes in the diagram are not to scale, as can be seen between stack and reformer, where the magnitude of the chemical energy flow (yellow) is larger than the one of electrical energy (black), even though it is 36 % compared to 39%. The black arrow is also thicker at its tail than at its head.
Still, this is an attention-grabbing Sankey diagram, and an interesting research, which made me read more about fuel cells and solid oxide fuel cells (SOFC) in particular on Wikipedia.

3 Comments
Comments are closed.