Sankey Diagrams

A Sankey diagram says more than 1000 pie charts

Menu
Samples

Fuel Cell System Performance

phineasFebruary 25, 2016

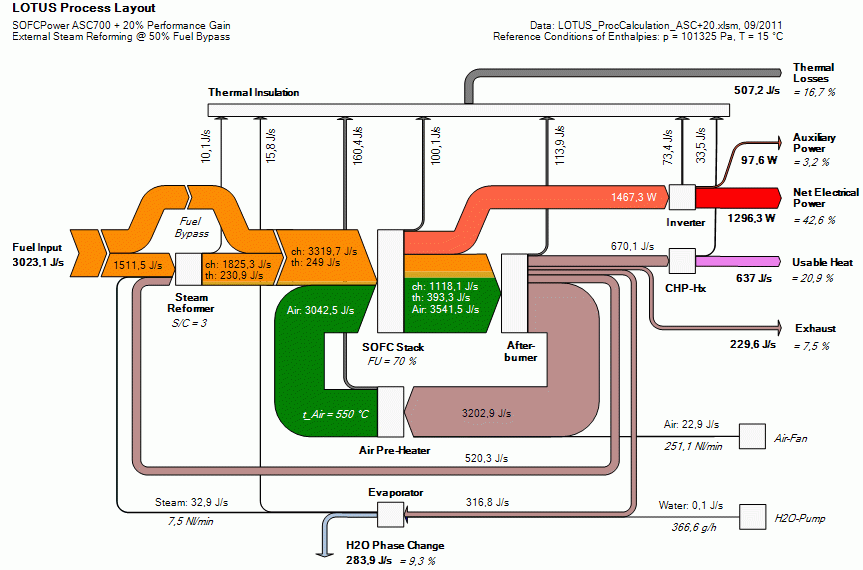
German Fraunhofer IKTS research institute features a Sankey diagram for a SOFC fuel cell system in this PowerPoint presentation (held 2012 at the Lucerne Fuel Cell Forum).

systemkonzept_tcm_fraunhofer

Flows are in J/s, the power output has been converted to Watt. Some volume flows and parameters are given as additional information on the flows.
Tagsfuel cell
Previous StoryAustralian Energy Flows 2012/2013
Next StorySouth China Sea Oil/LNG Transport

phineas

Pages

  • About
  • Privacy Policy
  • Sankey Definitions
  • Sankey Diagram Software
  • Who is this Sankey guy?

Categories

  • Fakes
  • General
  • History
  • Methodology
  • Publications
  • Samples

Tag Cloud

AustriabiomassbuildingCanadacarChinacircularcogenerationcostefficiencyenergyenergy balanceenergy efficiencyenergy lossEuropeexergyfinancefoodFranceGermanyGHGheathouseLatin AmericamapmetalMFAmoneyNetherlandsprocess technologyremakesoftwareSpainSwitzerlandtradetransportU.S.UKurbanverticalvideowastewaterwoodworld

Blogroll

  • ChartPorn
  • Density Design
  • EagerEyes
  • Flowing Data
  • Infosthetics Blog
  • InfoVis:Wiki
  • Junkcharts
  • MFA Diagrams
  • Visual Complexity
  • Visual Literacy
Sankey Diagrams, Proudly powered by WordPress. Privacy Policy