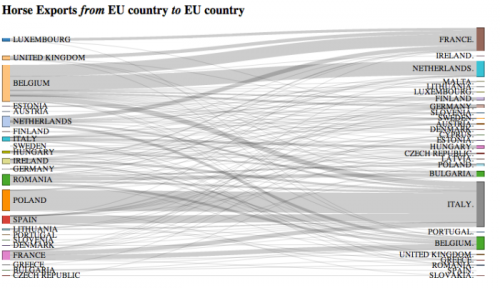
Blog reader Johannes send me a note and suggested to feature the below diagram. Thanks for that.
Tony Hirst from OUseful.info created it after seeing a map-based diagram for horse meat trade flows on the Guardian Data Blog. Tony used Mike Bostock’s D3s Sankey Plugin that allows creating this type of diagrams directly from data in Excel/CSV files. In his post he describes how he proceeded to build this Intra EU Horse Meat Trade diagram. Somewhat techie, but nevertheless makes an interesting read.
Overall trade quantity was more than 60.000 tonnes in 2012. Largest exporters are Belgium and Poland (left side), largest importers are Italy and France (right side). Data is from Eurostats.
The above is a only a static picture, but you can go here to play around with the interactive version. Data labels and quantities are available in the interactive version when you hover ths mouse over certain bands. You can also move the nodes up and down vertically and group the countries differently.
This special type of Sankey diagram is also refered to as distribution diagram and (…hate to say it in light of the current scandal) a Spaghetti diagram. Fineo and Parsets (see software list) can also be used for this type of diagrams where statistical data is grouped into categories (here: exporting and importing countries) and bands/streams/spaghettis are shown between the categories to represent the relationships between them.
Here is my May 2012 post on distribution diagrams with d3.js.

1 Comment
Comments are closed.