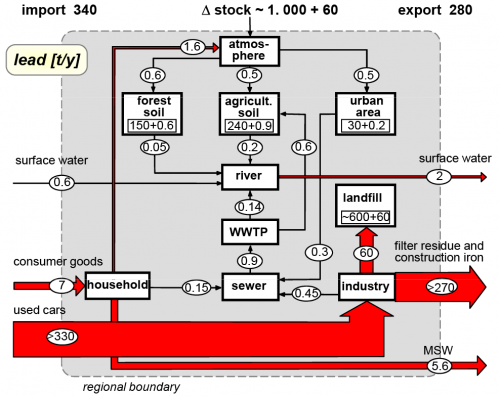
Material Flow Analysis (MFA) looks at substances or materials, often with a regional or national scope. MFA also has a stronger emphasis on stocks and stock changes. From the MFA blog (see blogroll on the right) comes the below diagram on lead flows.
The grey area delimits a region. Lead flow quantities are in tonnes per year. ‘Imports’ (to be understood as contamination or ingression here) to the region are from the left, ‘exports’ to the right. There is a net increase of lead ‘stocks’ in the region (accumulation in landfill).
Flows are on the same scale only for smaller quantities. The two large flows would have to be drawn much wider if they were on the same scale. Instead they have an upper cut-off indicated by the labels “>240” and “>330”.
