A visitor to this blog pointed me to the work and life of system ecologist Howard T. Odum.
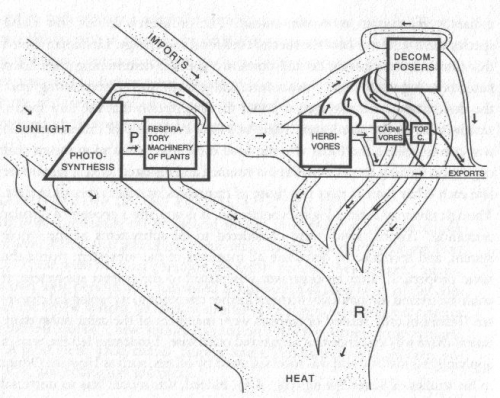
Odum “in his early work used a diagramming methodology very similar to the Sankey diagrams used in chemical process engineering. In this model energy and matter flows through an ecosystem”.
In Odum’s ‘Silver Spring Study’, he
…mapped in detail all the flow routes to and from the stream. He measured the energy input of sun and rain, and of all organic matter – even those of the bread the tourists threw to ducks and fish – and then measured that gradually left the spring. In this way he was able to establish the stream’s energy budget. (Wikipedia)
This diagram shows the energy flows in the ecosystem. The main contributors are sunlight and other biomass imports. Energy “leaves” the system as exports (extraction of animals and biomass) and mainly as decomposed matter. There are no absolute figures in this diagram, but the proportions seem to be represented by the arrow magnitudes.
The diagram has a nice “natural touch” to it, and at first sight one might think that you are looking at the arms of a river delta…

1 Comment
Comments are closed.