A nice idea for the use of Sankey diagrams can be found on this web page of the U.S. Army Corps of Engineers (USACE) in the Portland OR area.
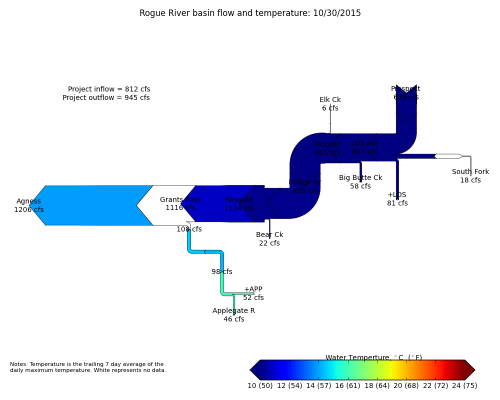
The diagram shows the flow of the Rogue river and its tributary streams. The fact that the river flows east to west makes this one of the rare examples of a right-to-left orientated Sankey diagrams.
The water volume is represented by the width of the arrow in each segment. Flows are in cubic feet per second (cfs)? At some points along the river the volume seems to increase much more than the feed contributes (e.g. at Bear Creek influx).
As an additional layer of information the color of the Sankey arrows indicates the trailing 7-day average temperature. Temperature color codes shown below.
