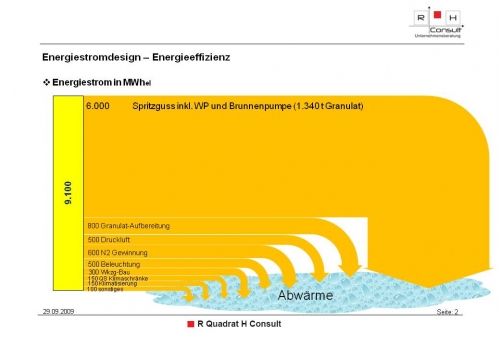
This simple energy consumption diagram shows a breakdown of electric energy in a company. It is shown – along with a second Sankey diagram – on the website of German consulting firm RQH consult.
Flows are in MWh electric energy. The largest chunk of the 9,100 MWh (per year?) is consumed by ‘Spritzguss inkl. WP und Brunnenpumpe’ (Google translate: ”Injection including WP and well pump”)
