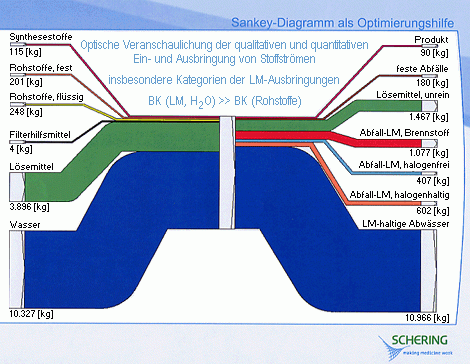
This simple Sankey diagram is displayed on the Berlin state environmental protection agency (in German only). It shows a breakdown of the input materials and of the outputs of a pharmaceutical synthesis process, with a focus on solvents (“LM”).
Water is the largest chunk of the inputs, as well as on the output side (I understand that the water is polluted with solvents after the synthesis and need special treatment).
Flows are in kg, and mostly to scale. The Sankey arrows for the smaller quantities like the actual product yield (90 kg only) seem to have a minimum width or are emphasized ny a stromger border line in order to remain visible.
