I liked the below 3-in-1 Sankey diagram from the e!Sankey website. Actually three different Sankey diagrams of the a steam generation process.
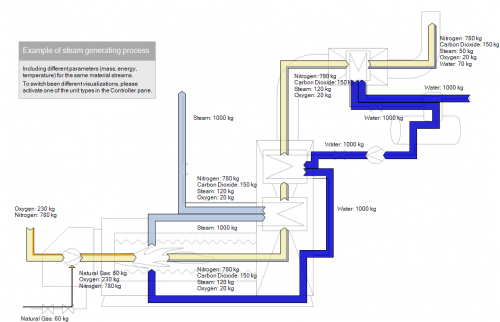
The first is a quantitative (mass) view of the process where water, steam, gaseous emissions are shown in kilograms:
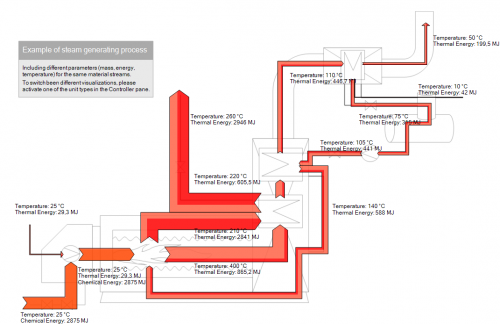
Using the same basic structure, the second shows the energy content within the flows. Values are in MJ. Temperature is shown as additional information with a lighter color.
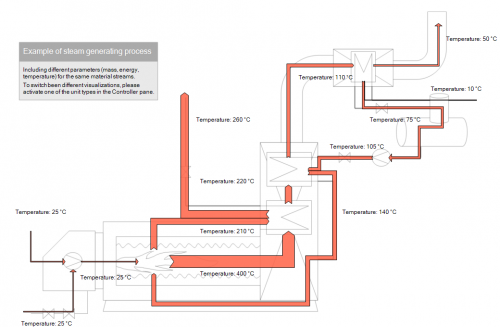
And finally the temperature only Sankey diagram of the steam generation process. Here the width of the arrows shows the temperature of the steam or gas.
In the background is a transparent technical process diagram of the steam process. Thanks to Michael for providing these Sankey diagrams.


