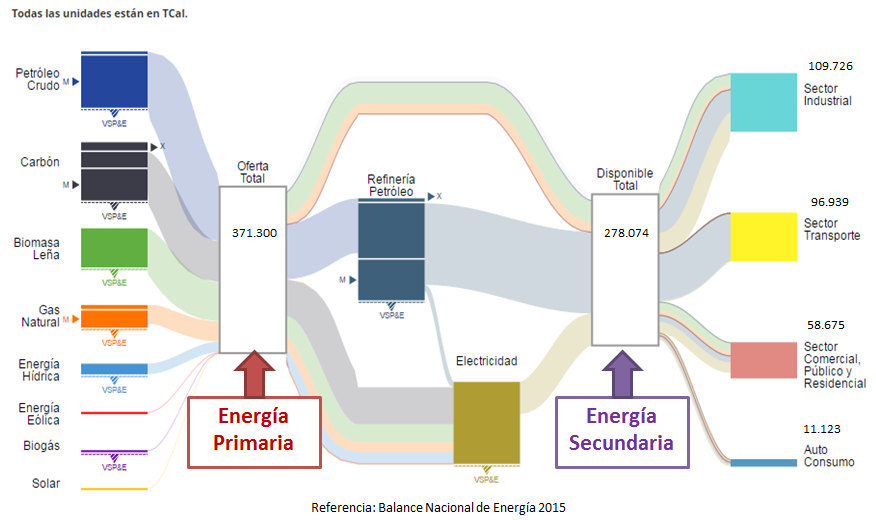
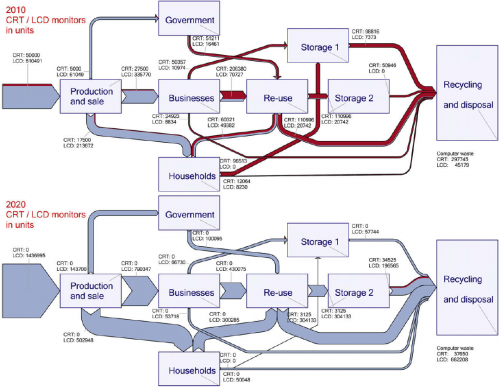
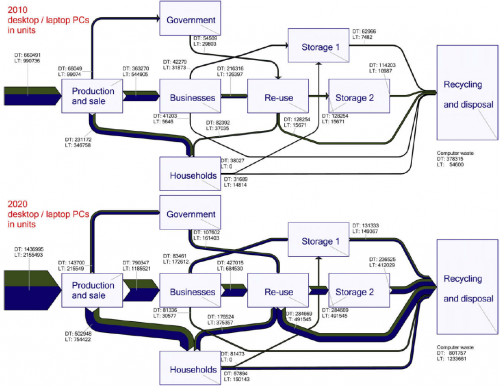
This Sankey diagram depicting the energy balance of Chile for 2015 can be found on the website Gestiona Energía MiPyMEs (MiPyMEs is the Spanish term for ‘small and medium-sized enterprises’, SMEs).
Flows are in TCal (teracalories), a unit for energy we don’t get to see very often (1 TCal = 4,205 Joules). What surprised me most in this figure was that ‘Biomasa Leña’ (biomass firewood) is the third most used primary energy source. The accompanying pie chart on the same page confirms that crude oil (25%) and coal (20%) are the most important sources, followed by biomass and oil derivates (each 19%). I guess this should read ‘biomass AND firewood’ rather than ‘biomass firewood’.
Some design shortcomings, in particular where the downward sloping stacked Sankey arrow turns to run horizontally to join the node ‘Electricidad’, and at the input side of the primary energy box, where the flows for ‘Petróleo Crudo’, ‘Carbón’ and ‘Biomasa Leña’ overlap and somehow don’t seem to hold their width all the way. My guess is that this is owed to the wish to keep the figure as compact as possible.
Addendum 11/2018: The energy balance Sankey diagram for Chile can be produced at the Energía Abierta website of The Chilean National Energy Commission.


