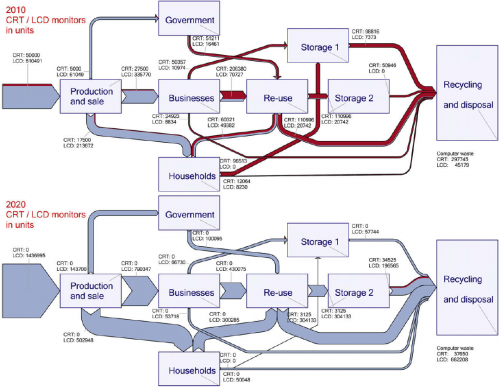
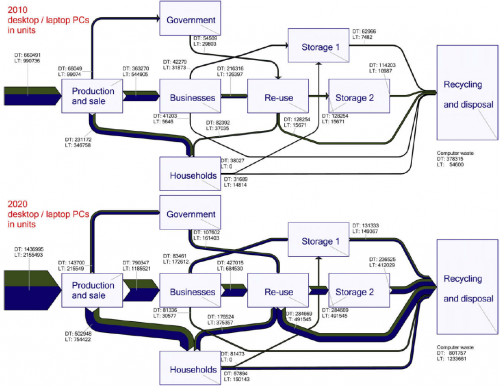
This post on the MFA diagram blog directed me towards a study on computer waste in Chile. The Sankey diagrams featured are for CRT/LCD displays and laptop/desktop computers,
These are the flows of CRT (red) and LCD (blue) in 2010 and expected units in 2020
and the desktop (green) and laptop computers (dark blue) flows in 2010 and expected for 2020 (no. of units).
The full scientific paper can be found here.
(via MFA Diagram blog)

