Tag: coal

Zero Emission Coal System Sankey Diagram

From a July 2013 article titled ‘Energy and exergy analyses of a Zero emission coal system’ by Linbao Yan, Boshu He, Xiaohui Pei, and Chaojun Wang of Beijing Jiaotong University, available at Researchgate. This Sankey diagram is for “the exergy flow of the improved Z[ero] E[mission] C[oal] system at benchmark condition”.

Note: Image not available anymore

All flows are in kJ. The individual process steps if the system are only labeled with acronyms. They are explained in the article: GF is gasifier, CL is cleaner, RF is a reformer, and CH is a CO2 heater. The article also features the energy flow Sankey diagram.
Coal Trade Flows Map

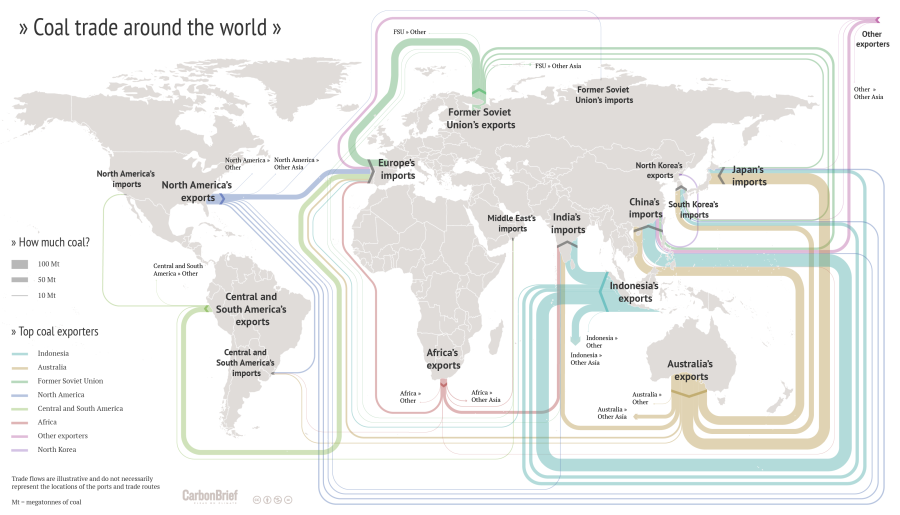
Drawing Sankey diagrams on a world map to show flows between different geographical location is always a challenge. One of the inherent problems is that large (=broad) arrows may run between two points on the map located very close to each other. Another problem is that one wishes to have the arrows more or less along the actual trade routes, which in many cases is close to impossible (take, for example, ships going through the Panama or the Suez canal).

I have shown quite a number of ‘Sankey diagram maps’ here on the blog, but most of them had shortcomings. Now here is an example that does extremely well in tackling the issue of Sankey diagram flows on a world map.


(CC licence – Carbon Brief)

This flow map of coal exports around the world shows the top exporters. It was crafted by Rosamund Pearce for the Carbon Brief article “Mapped: The global coal trade”. She decided to route the Sankey arrows nicely sorted, in parallel, and not along the actual shipping paths. See how much of the coal trade from Indonesia to China is led “virtually” south of Australia and New Zealand? Additionally the arrows are not led precisely to the actual port, but rather connect at a suitable place of each continent. With these simplifications the trade flow map is much clearer, understandable.

Another world coal flow diagram from 2012 can be found here.

Water Use in Coal Power Plant

This presentation on ‘Water Management for Fossil Energy Systems’ by Susan M. Maley, Technology Manager for Crosscutting Research at the U.S. Department of Energy (DOE) / National Energy Technology Laboratory (NETL) gives an overview of the activities and research into ‘Current Activities in Water Management Research and Development’.

On page 9 it features these two Sankey digrams showing water usage in a 500 MW pulverized coal plant.

On the left the situation without CO2 capture, on the right with CO2 capture. Water withdrawal almost doubles (524 gal/MWh to 1049 gal/MWh) when implementing CO2 capture.

Mind that the left and the right Sankey diagram can not be compared directly as they use a different scaling factor.

World Coal Flows

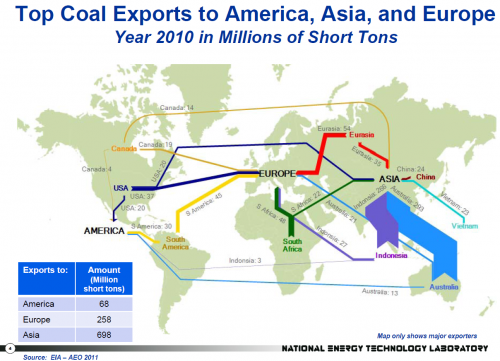
As promised in this post on U.S. 2010 Energy Flows here are some other Sankey diagrams from a July 2012 publication by Eric Shuster, NETL/DOE. These diagrams show world trade flows for coal.

The first one features the top coal exporters and their 2010 exports of coal to the regions America, Europe and Asia. This does not include domestic production, but just export. Indonesia and Australia are clearly the main exporters. Unit is in Mio short tons.

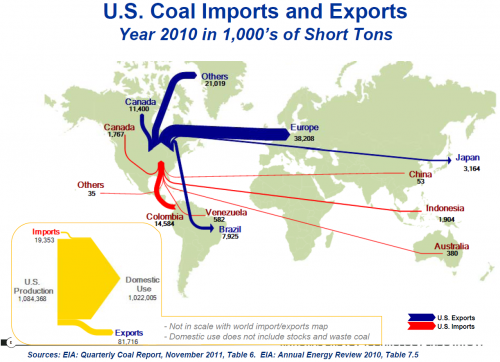
The other coal Sankey diagram is for U.S. coal imports and exports in 2010. Here the unit is in 1,000s of short tons, hence the two must not be directly compared. Also, the inset of the yellow arrow for domestic production in comparison to U.S. import/export is not to scale with the other flows shown on the flow map. In fact, all the blue Sankey arrows appear as a small export flow (81,716) in the yellow Sankey miniature, and all red flows on the world map are summarized as the tiny import flows (19,353).

The U.S. is primarily using its domestic coal and still able to export the surplus.

Stay tuned to see the world’s natural gas flows from the same publication

United States Annual Energy Review 2008

U.S. Energy Information Admmoinstration (EIA) now has the 2008 Annual Energy Review (AER) on their website. It contains Sankey diagrams for the nation’s overall energy flows (almost a “classic”) and four additional separate Sankey diagrams for petroleum, natural gas, coal and electricity.

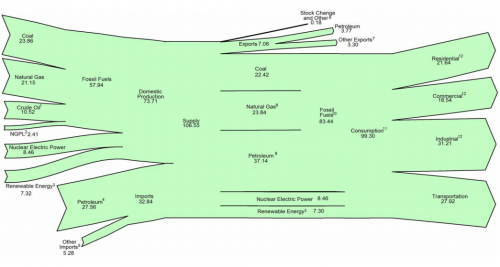
This is the U.S. Energy Flow diagram for 2008:

Check the original PDF file with the accompanying footnotes for further details. Overall energy consumption in 2008 was 99 Quadrillion BTUs (preliminary value, slightly down from the 101 Quadrillion BTUs in 2007.

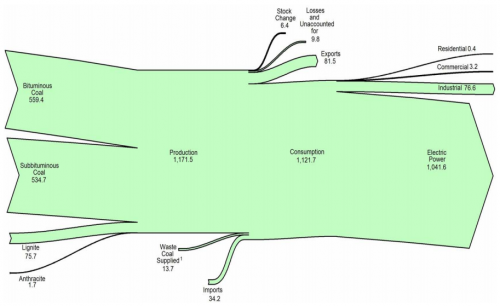
Among the other diagrams in the report, I chose to show the one for coal. 1121 mio. short tons have been consumed in the U.S. in 2008, mainly (1041 mio short tons) for electric power generation. The U.S. is a net coal exporter.

The diagram has a weird sinking downward feeling, caused by the fact that the main left-to-right orientation axis is not maintained. Looking at this it makes me want to shout out: “Hey coal Sankey, cheer up, life isn’t that black…!” 😉

The original full AER report (7.5 MB) can be found here.

Virginia Natural Gas Flow Sankey

The Virginia Center for Coal and Energy Research at Virgina Tech has a website on Virgina Energy Patterns and Trends (VETP).

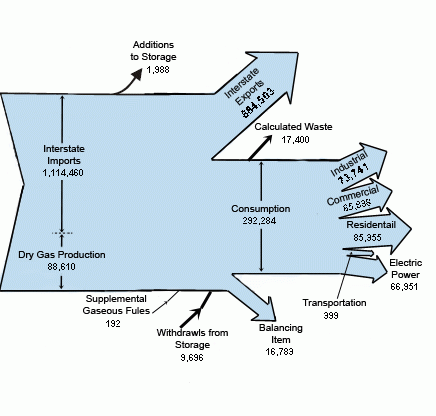
This summary page on natural gas features a Sankey diagram for natural gas flows in Virginia in 2005.


Flows are in million cubic feet. Note that the division line between dry gas production (88.610 million cubic feet) and interstate imports (1.114.460 million cubic feet) overemphasizes VA’s own production. Also the magnitude of the “consumption” flow and “interstate exports” are not to scale, probably owed to the desire of the designer to be able to split up the consumption arrow into separate arrows. The transportation arrow is exaggerated, and would only be a thin line if to scale.

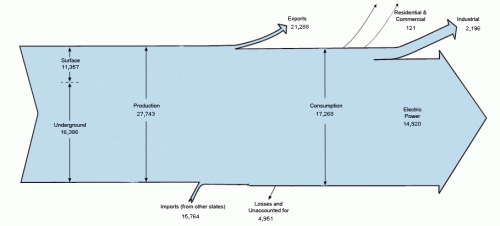
On the VETP summary page for coal, there is another interesting Sankey, also for 2005.

The second one also has some pecularities: The Sankey arrows for imports (15.764 thousand short tons) and exports (21.288 thousand short tons) of coal are not to scale, neither are the losses/unaccounted coal flows 4.951 thousand short tons.

Reminder to self: If I find the time I’ll do these two diagrams properly and to scale.