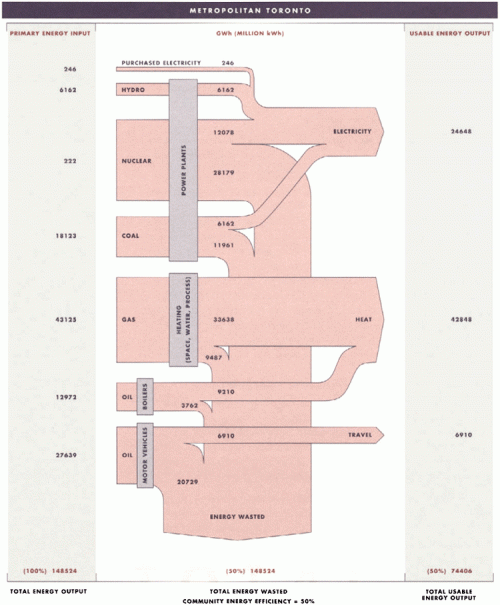
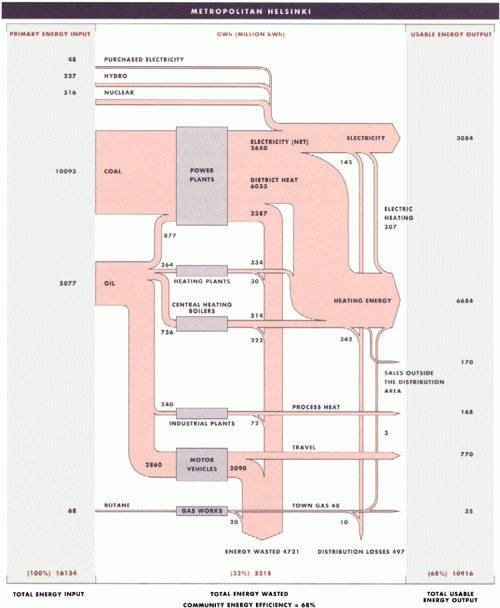
I have posted several Sankey diagrams depicting the energy flows of countries. At least California and West Virginia have published state energy flow Sankey diagrams. I was quite excited to discover the two metropolitan energy flow Sankey diagrams shown below in this publication. They are for Toronto and Helsinki and show energy flows in 1988 in these communities.
The two diagrams show energy consumption and use in Toronto (above) and Helsinki (below). Even though the absolute figures in GWh are given, one shouldn’t directly compare them. A per capita basis would be fairer (Toronto had a population of 2.5 mio in 2006, more than 5 mio. in the metro area, while Helsinki had 580.000 inhabitants in 2008 in the city, 1.3 mio in the greater Helsinki area — Toronto is today 4.5 times larger than Helsinki). Both are “cold-climate municipalities”.
The publication calculates a ‘community energy efficiency’ of 50% for Toronto and 68% for Helsinki. “A comparison of the two municipalities reveals that Helsinki significantly improved its efficiency by using the waste heat that is produced by local coal power plants to warm 90% of the buildings and homes in Helsinki. Further analysis has demonstrated that Helsinki’s energy system was able to achieve its overall level of 68% efficiency because the city’s compact land-use pattern made investments in energy-saving infrastructure, such as district heating and public transit, economically viable.”
Does anybody know other metropolitan energy flow studies? I am aware of research activities in the field of urban material flow accounts or urban metabolism (e.g. Lisbon) but have to check whether they show Sankey diagrams in their publications.
