Sankey Diagrams

A Sankey diagram says more than 1000 pie charts

Menu
Samples

Online plant measurement

phineasJanuary 8, 2013

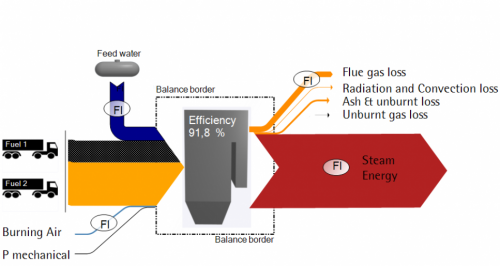
Indmeas, an engineering firm based in Espoo, Finland, provides a tool for on-line efficiency calculation and optimizing plant operation. Their data can be visualized using Sankey diagrams.

indemeas_flue_gas

Small, but nice. Unfortunately neither units nor quantities in this schematic sample pic I took from their website.
TagsFinland
Previous StoryPlease help my do my science homework
Next StoryCanada Energy Flows

phineas

Pages

  • About
  • Privacy Policy
  • Sankey Definitions
  • Sankey Diagram Software
  • Who is this Sankey guy?

Categories

  • Fakes
  • General
  • History
  • Methodology
  • Publications
  • Samples

Tag Cloud

AustriabiomassbuildingCanadacarChinacircularcogenerationcostefficiencyenergyenergy balanceenergy efficiencyenergy lossEuropeexergyfinancefoodFranceGermanyGHGheathouseLatin AmericamapmetalMFAmoneyNetherlandsprocess technologyremakesoftwareSpainSwitzerlandtradetransportU.S.UKurbanverticalvideowastewaterwoodworld

Blogroll

  • ChartPorn
  • Density Design
  • EagerEyes
  • Flowing Data
  • Infosthetics Blog
  • InfoVis:Wiki
  • Junkcharts
  • MFA Diagrams
  • Visual Complexity
  • Visual Literacy
Sankey Diagrams, Proudly powered by WordPress. Privacy Policy